
At CWS we have been heavily focused on growth-oriented markets that have large in-migration due to a competitive cost of living, high quality of life, and pro-business environment. This has led us to be heavily concentrated in metro areas such as Austin, Atlanta, Dallas, Houston, Phoenix, and Raleigh, as well as some other cities. While we have clearly missed the boat by not having Florida exposure, we are still well represented in some of the fastest-growing metros.

While we do have some urban exposure, we are far more concentrated in suburban locations in these growing areas. This has been particularly beneficial during Covid when there was a large exodus out of cities into the suburbs as the following chart shows.

One can see how poorly most large urban areas have done in terms of losing population over the last number of years. Dallas and Houston are notable exceptions.
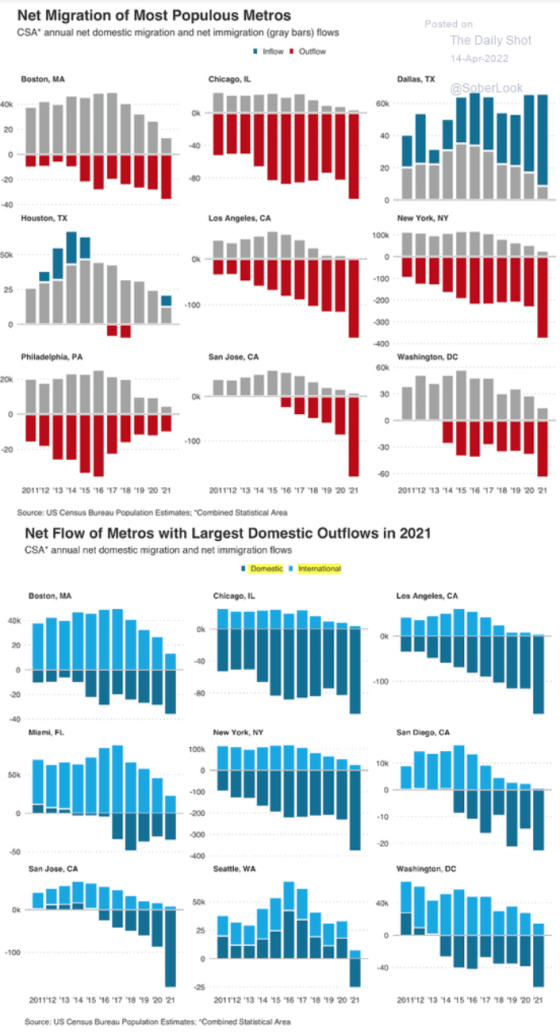
Seattle, a market in which we do have some properties, has seemingly turned on a dime, and not for the positive. We think this has a lot to do with the very anti-business, woke city leadership that has been far too tolerant of trends that can lead to urban decay such as crime, drug use, and homelessness while being almost virulently anti-business and especially anti-landlord. People vote based on their economic prospects and perception of safety and overall well-being. It’s clear that urban Seattle has become a far less desirable city in which to live as the rapid reversal from strong population growth to an exodus shows.
One of the great challenges facing the real estate market, economy, and credit markets is the much-diminished demand for office space due to Covid catalyzing working remotely. The need for office space has clearly diminished and this could be a long-term secular trend, rather than a temporary Covid phenomenon. The Wall Street Journal wrote about the challenges facing landlords and lenders with office building loans due to a record amount of space with leases expiring. JLL has been tracking office space coming up for renewal each year since 2015. This year will be the highest so far with 243 million square feet coming due. This represents about 11% of the total office market.

Much of the rise in space coming up for renewal is due to leases expiring in 2020 and 2021 having short-term extensions negotiated because firms were not sure how much less space they would need in a hybrid model. Businesses did not have the confidence to renew for 10 years or longer.
National vacancy rates are at 12.2%, which has increased from 9.6% since the end of 2019 according to CoStar Group Inc. With vacancy rates expected to move higher as firms give back more space than is leased, this will put pressure on office building loans. According to the article, and much to my surprise,
Troubled loans to office building owners are also on the rise. In February, 21.2% of office loans made after the global financial crisis packaged into commercial mortgage securities were either being handled by special servicers or on watch lists, two closely watched categories that could lead to defaults, according to a Barclays report. That’s the highest level since 2010.
About $1.1 trillion worth of loans backed by office buildings are outstanding and about $320 billion of those loans are maturing this year and next, according to data firm Trepp Inc.
I thought the last two paragraphs of the article gets to the heart of the matter in a pretty humorous, but realistic, sort of way.
New York-based law firm Herrick Feinstein LLP wants to reduce its office space by 30% to 40% when its lease expires in a few years, said Jonathan Adelsberg, co-chair of the firm’s real estate department.
He said he isn’t thrilled about giving up his private conference table, but spending less on office space means the firm’s lawyers can take home more pay. “You can have a bigger office or a bigger home,” he said. “I mean, what would you prefer?”
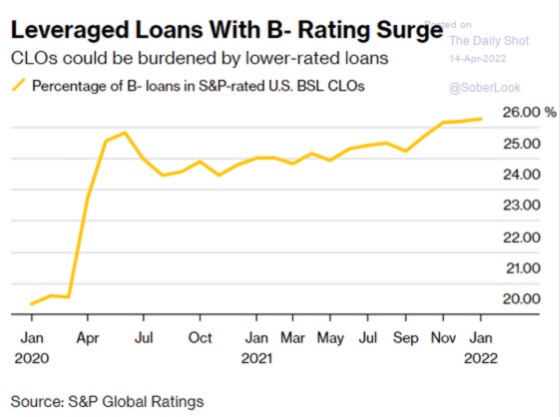
The following chart shows how mortgage pools being sold to investors have been increasingly populated by lower-rated loans. This would tend to corroborate what the article cited in terms of the greater number of loan delinquencies and defaults since the onset of the pandemic.
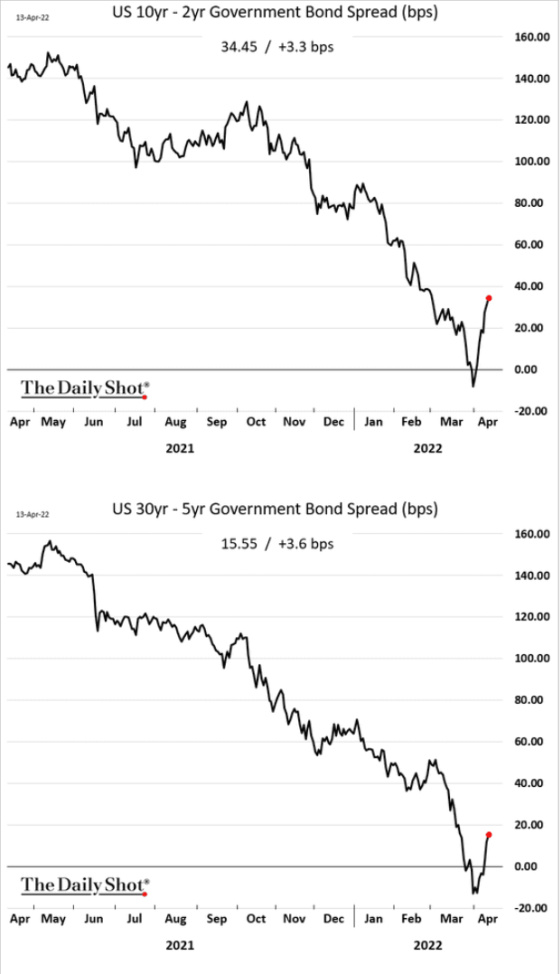
Another risk of course is a slowing or contracting economy which would further curtail the demand for office space. I wrote last week how an inverted yield curve that then steepens has been a precursor to a recession during the last four cycles. Here are a couple of charts showing how the steepening has now taken place after inversions.
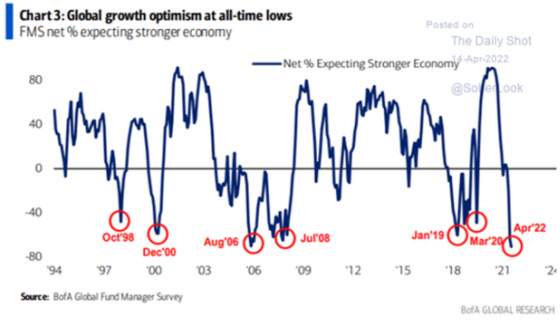
Unfortunately, optimism regarding global growth has been deteriorating which doesn’t bode well for company leaders making big office commitments.
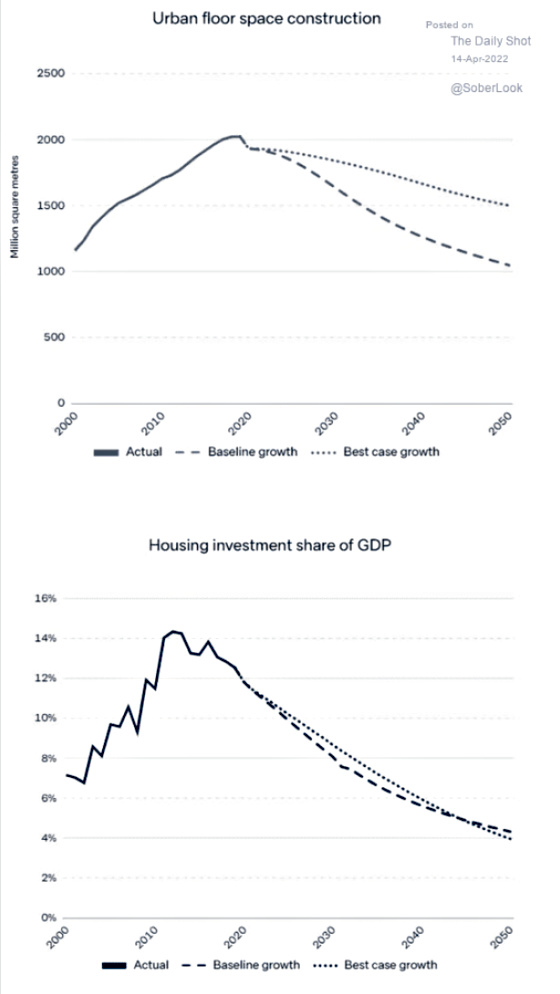
With China being so important to economic growth and its major engine being real estate, especially housing, I found these two charts very interesting. The first shows how much construction there has been as measured by floor space, and how it is expected to drop significantly due to many areas being overbuilt as well as China starting to rapidly age. The second shows how housing as a percentage of the overall economy is expected to drop steadily and quite significantly over the next 30 years. This could be a further headwind to interest rates rising materially as this should negatively impact China’s economic growth and the spillover effects on the world economy.
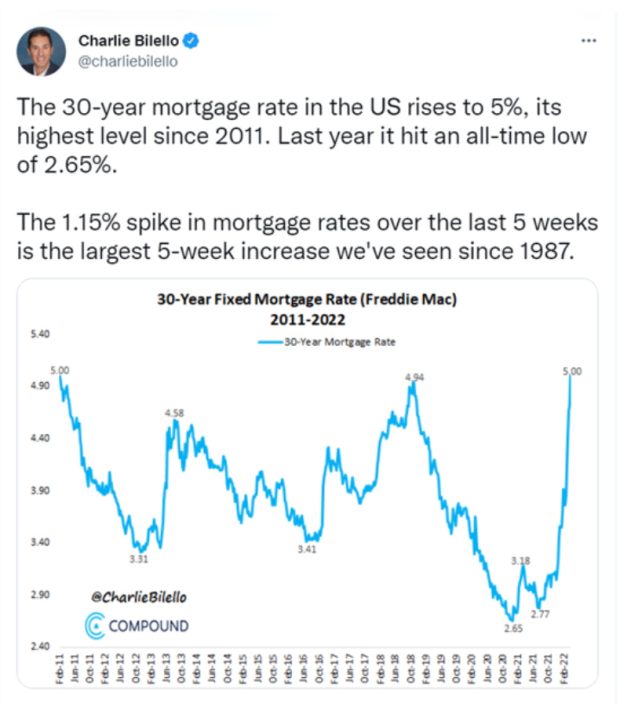
I’ll leave you with a couple of fun facts that are interest rate-related. The carnage in the bond market, especially long-term Treasuries has been brutal. This chart shows just how bad it’s been.

This has impacted mortgage rates in a very powerful way.
The combination of very high home prices and a rapid increase in mortgage rates has resulted in a tremendous jump in mortgage payments for those purchasing homes today as the following chart from Redfin shows.
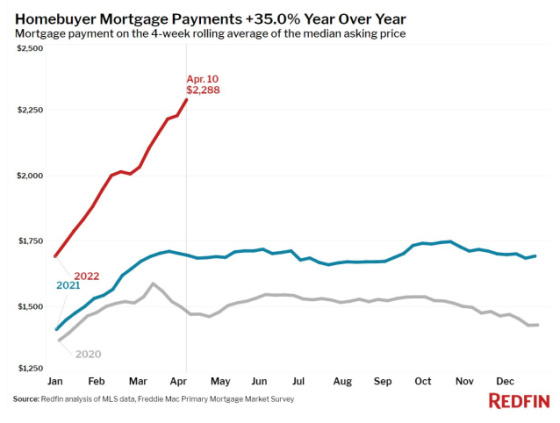
It will be interesting to see how much this impacts the demand for housing. The one thing I can be fairly certain about is that it should keep more people renting for longer as purchasing a home becomes further out of reach for large numbers of people.
I hope you had a wonderful holiday weekend.
Gary, really enjoyed this article.
Regards
Bill Williams