
I subscribe to The Daily Shot which is an economics and finance-oriented site that aggregates a tremendous number of charts to give investors a great visual overview of key aspects of the economy, both domestic and global, as well as financial markets. I have to confess that when I tap into their charts for a blog post I feel as though I’m back in junior high or high school relying almost solely on an encyclopedia to do a research paper versus tapping into a multitude of other sources. It feels like cheating in some ways. On the other hand, when you find something that works then don’t overthink it, just go for it. It’s somewhat akin to the scene in Indiana Jones when Harrison Ford is confronted with a local strongman who is an expert in swordsmanship and he shows his dexterity with his swords when facing off with Indiana Jones to intimidate him before engaging in battle. Indiana looks at him at first a little surprised by his talents and then this look of annoyance comes across his face and he decides that he just doesn’t have the energy or skill to fight on his terms, even though that’s the noble and customary thing to do being on his turf. So what does he do? He takes his revolver out of his pocket and shoots him and puts an end to the theatrics. Modernity and raw power trumps honor almost every time, at least in the short run.
The Daily Shot graphs are my revolver equivalent and this week I’m going to tap into their recent charts related to the incredibly hot housing market. It’s like COVID went off and left the smoking gun of the housing market behind as consumers have really jumped on lower mortgage rates and the desire for more space as more people work from home and have less of a desire to be in urban areas.
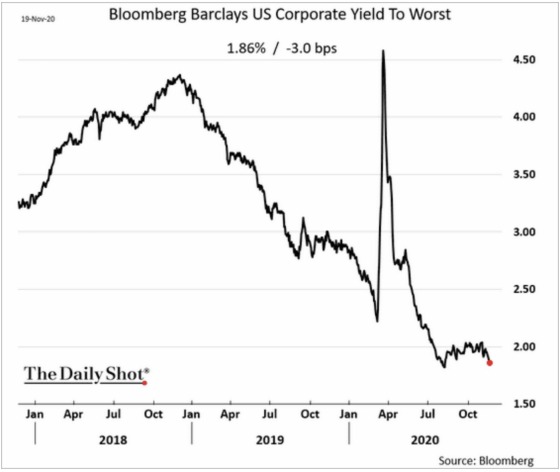
Here is a chart showing how mortgage rates have dropped significantly over the last couple of years.

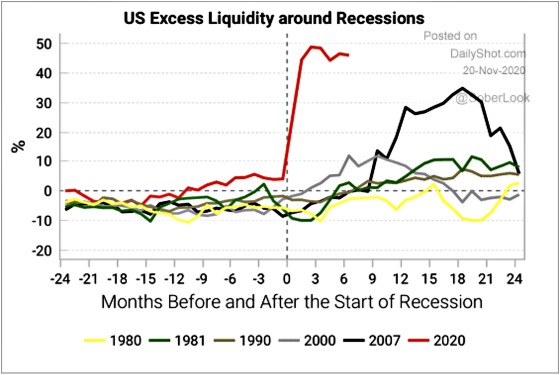
This chart shows how the Federal Reserve has generated an enormous amount of excess liquidity relative to other recessions and this has clearly been a big contributor to mortgage rates dropping as well as other debt instruments.
After corporate bond yields shot up in the wake of the economic shutdown, they came crashing back down when it became clear that the Federal Reserve would not let bond investors suffer widespread losses.
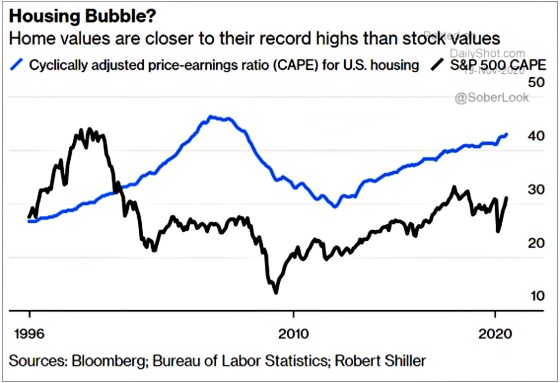
One indicator of value shows that home prices are approaching record highs which isn’t surprising given the demand and low-interest rates.
Despite home prices increasing, payments are still far below where they were in 2007-8 due to the significant drop in mortgage rates.

Mark Twain said that “History doesn’t repeat itself, but it often rhymes.”Click To Tweet
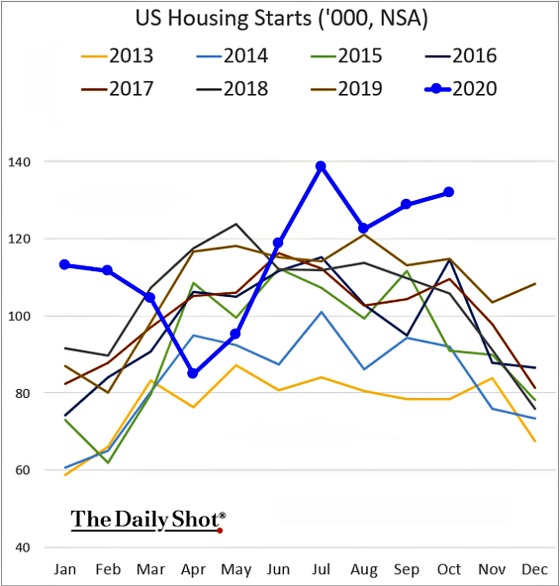
The last recession was clearly housing driven, but in this one housing has prospered, which is not typical during recessions. This chart shows how single-family starts have exploded higher relative to its baseline. This was not the case during the Great Recession.

And unlike the last recession which was catalyzed by terrible lending standards in the home mortgage market that were more focused on manufacturing borrowers to create loans that could be sold profitably versus creating high-quality loans, this one is being driven by higher-quality borrowers.
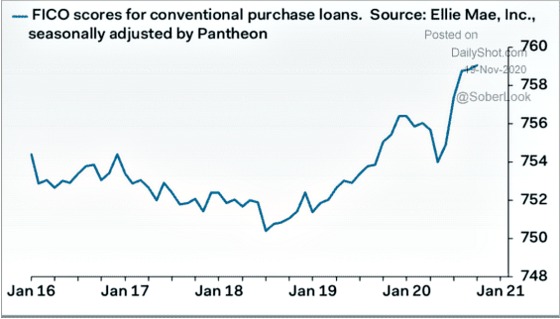
This next chart shows how the dollar volume of high credit score borrowers has rocketed upward.

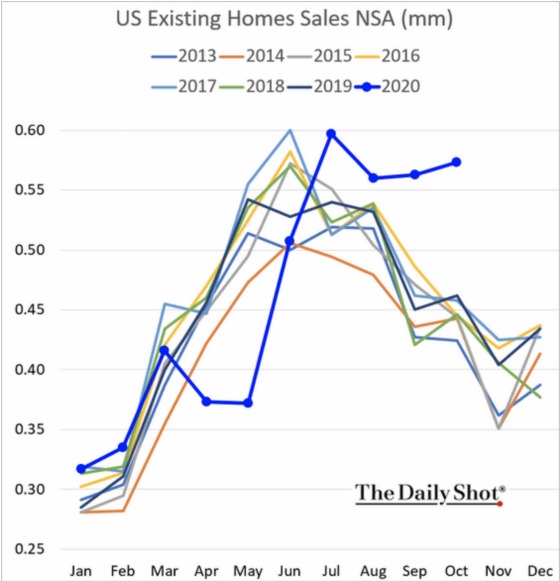
Home sales are on fire as the next two charts show.

Housing starts are up sharply relative to past years, particularly in the single-family category.

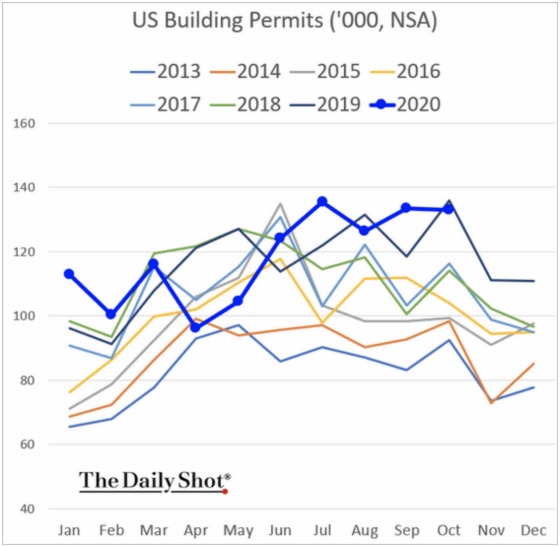
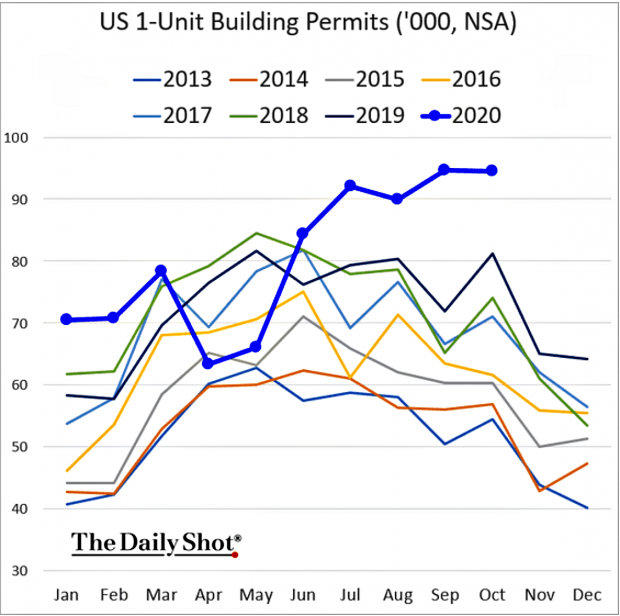
Permits are elevated as well with single-family leading the charge here too as well.
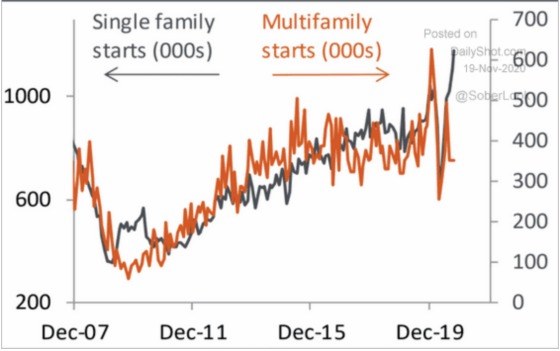
From a multi-family perspective, this drop in starts is needed since the number of units under construction, while dropping, is still close to its highest levels in recent decades and far above the 2006 high.

Despite the significant increase in supply, the vacancy rate for investment-grade apartments (like the ones CWS owns) remains low.

Finally, I’m always keeping my eye on fiscal policy as this has clearly propped up the economy during Covid. Right now, the trend is discouraging with no agreement for more fiscal stimulus at this point. This chart shows how important fiscal policy has been towards contributing to growth in GDP since Covid.

This chart shows how fiscal policy will become less stimulative and may start to contract if no new legislation is passed.

This chart shows the number of people who have had their benefits run out.

There are still millions of people receiving unemployment benefits.
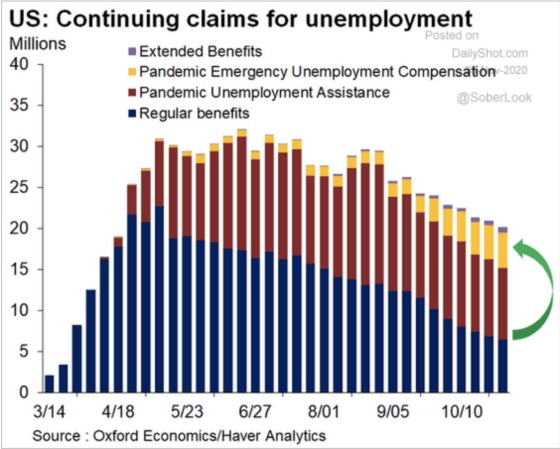
The labor market is still bruised and battered and has a long way to go before recovering all of the jobs lost during the Covid recession.

Those who have remained financially strong or have access to family capital have begun to take advantage of their strong credit and low mortgage rates and changing preferences to aggressively move into homeownership. And while values are stretched, I’m hard-pressed to see any meaningful correction with most homes being in strong hands, continued lender forbearance programs holding off putting distressed assets onto the market (which would probably be snatched up with all of the individual and institutional demand for homes), continued Federal Reserve support of low-interest rates, and the ability to work from home becoming much more pervasive and permanent.
Leave a Reply