
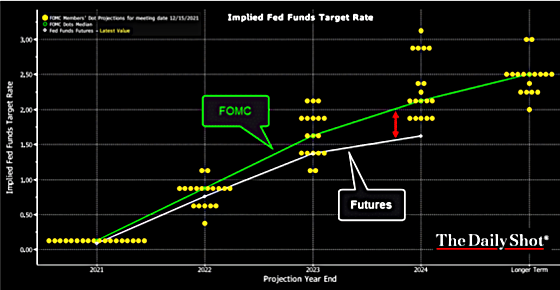
The Fed blinked and acknowledged that inflation may not be transitory. When combined with its perception that the labor market is on the way to being healed, Jerome Powell has moved up the Fed’s estimate of the first rate hike by more than a year. Previously he said the Fed would not move rates until the end of 2023 at the earliest. The following chart shows that there is now a 50% chance by the March 2022 Fed meeting. The Fed signaled that it would raise rates three times in 2022.

A funny thing happened on the way to raising rates, however. The market doesn’t believe the Fed will be able to go as high as the Fed thinks in later years as this chart shows.
One of my favorite indicators of bond investors’ beliefs about the future strength of the economy is the yield differential between the 10-year Treasury and the 2-year Treasury notes. One can see that it has narrowed quite significantly, especially in the wake of the Fed’s meeting and Powell’s press conference last week. This suggests that the Fed can only go so far in tightening and that the market believes that it will result in the economy slowing.
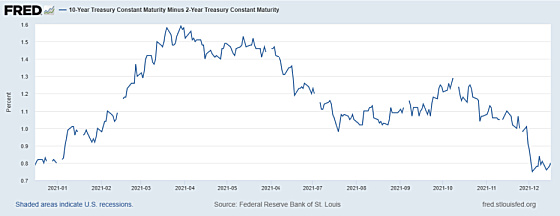
Here is a much longer-term chart of this same indicator. One can see how, in spite of more rapid growth in the wake of monetary and fiscal stimulus coming out of Covid, investors never priced in a robust, sustained recovery. Its recent high was at about half of previous cyclical peaks and now is on a downtrend.

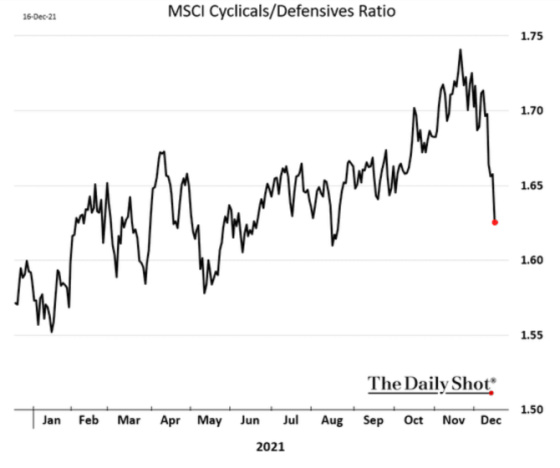
Stock market investors have also gotten more defensive in the wake of the Fed cutting back its purchases of Treasuries and mortgage-backed securities much more aggressively and signaling earlier rate hikes. This chart shows the ratio between economically sensitive cyclical stocks and defensive stocks that hold up well in slow-growing environments. It has dropped sharply in a short period of time which suggests investors might be pricing in an economic slowdown.
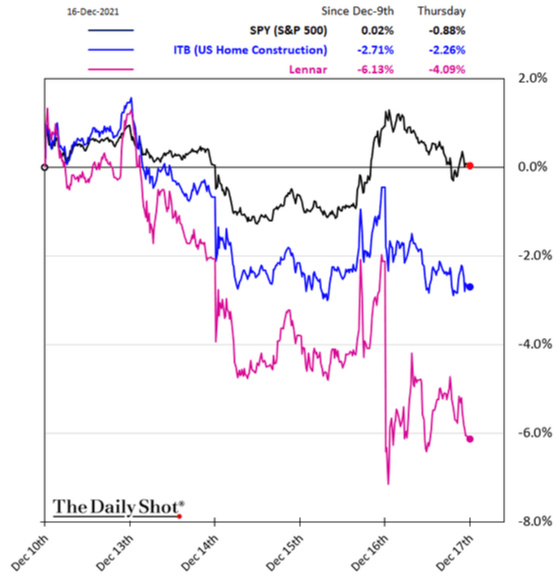
The next two charts are interesting in that the 10-year Treasury yield has come down which should filter through to lower mortgage rates and yet homebuilders have underperformed. Perhaps investors think that demand may be impacted by a slowing economy or affordability issues related to higher costs and supply chain issues or some combination of both. Pure speculation here.

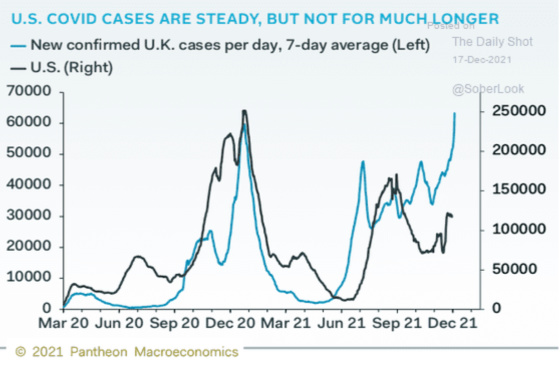
Another potential headwind is the impact of the Omicron variant on the economy as it may negatively affect travel, dining out, entertainment, etc. This chart shows how closely correlated Covid cases in the United States are with the U.K. It seems inevitable that cases will jump materially here.
Here is a forecast for U.K. Covid cases which are projected to soar. It’s interesting to see that the cohorts with the most cases are young adults in London which should be expected to be the case here as well because they have a relatively meaningful percentage of unvaccinated people.

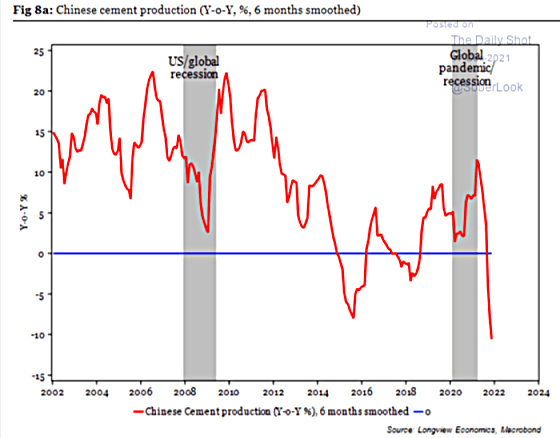
When evaluating the economic outlook and future interest rates China must always be taken into consideration. One can see how cement production has contracted meaningfully as a result of the large pullback in construction projects. The financing bubble for developers in China has definitely burst which is a big headwind for not only the Chinese economy but potentially for the global economy as well. This could lead to lower prices for industrial commodities.

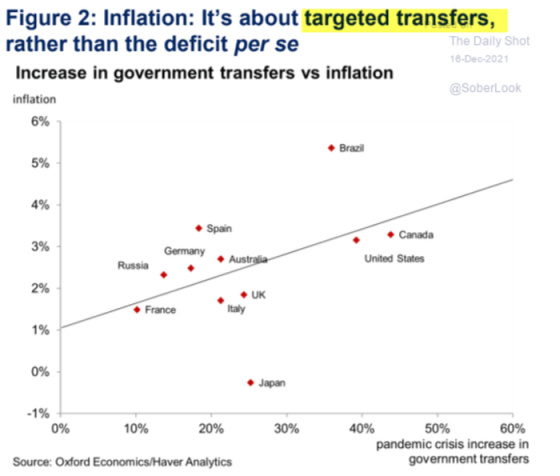
Inflation is obviously a big issue not only in the United States but in most major economies as well. The following chart shows the positive correlation between the increase in government transfers and inflation. With the ending of pandemic stimulus programs, however, fiscal policy will serve to be another economic headwind over the next couple of years absent any major policy changes. This could serve to bring down inflation rates.
One can see that global inflation, along with other factors, has really impacted home values around the world as well.

Finally, now that the Fed appears to be on a path to tightening, the question should be what will get broken as a result of credit becoming more costly and potentially less accessible? And when will the next recession be that will be presumably triggered by financial excesses in the system getting flushed out? This chart shows the pain points from previous Fed tightening cycles.

I found this analysis from Deutsche Bank interesting in terms of identifying time parameters and influences for ballparking when the next recession may hit.
A look at the table in a recent DB note “When the Fed hike: what happens next?” suggests the median and average time to the next recession is 37 and 42 months after the first hike. So that takes us to July 2025 and December 2025 respectively. That said, the earliest gap over 13 cycles is 11 months and that would take us to May 2023.
Alternatively, if we go a different route and look at the yield curve, today’s CoTD shows that the 2s10s pretty much always flatten after the first hike. By an average of 80bps over the next 12 months. So a June 2022 first hike may bring an inversion by June 2023 given the 2s10s currently sits at just under 80bps. Obviously, that assumes a flat curve from now until June next year which is a big assumption.
Anyway, a recession occurs around 18 months after the 2s10s inverts on average. So that would signal the average recession starting around December 2024. Prior to the pandemic, the earliest a recession occurred after a 2s10s inversion was 9 months so that would be around March 2023.
Fasten your seatbelts as 2022 should be a very interesting year. The market’s reaction to the Fed pivot from patience to tightening has only reinforced my belief in continuing to recommend we stick with floating-rate loans.
Thanks Gary!
Gary,
Thank you! Great analysis as usual.
It has been 13 years since the Fed cut rates. Can you tell me when we can we stop saying we are in a “low interest rate environment”?