
The multi-trillion dollar question is whether inflation is transitory. The Fed and other central bankers believe it is as this chart depicts.

As I’ve written about before, the Fed’s reaction function has switched from a forecasting-based approach to one that is now outcomes-focused in terms of needing to see tangible improvements occurring on Main Street even if it leads to speculation and large rewards on Wall Street. I keep taking the Fed at its word that it won’t raise short-term rates until at least the beginning of 2024.
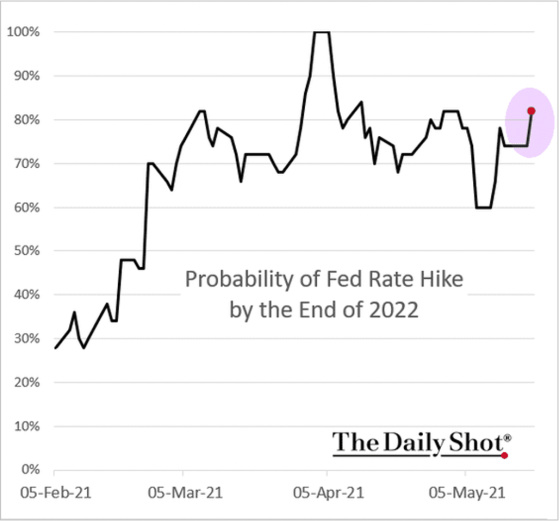
Investors are betting otherwise, as the following chart shows.
The obvious first step for the Fed in taking some accommodation away is to start tapering its purchases of Treasuries and mortgage-backed securities. Chatter has already begun with the release of the most recent minutes of the Open Market Committee meeting to discuss the economy and monetary policy.

The market is betting that inflation is not transitory in the short to medium term such that the Fed will have to hike sooner than it has publicly stated. I’m still betting on the Fed holding firm. Only time will tell who will be right.
A recent opinion piece on Bloomberg believes that we might be seeing the first signs of inflation being transitory with housing being the canary in the coal mine. The writer thinks we’re seeing the first push back against higher prices among buyers and builders. Builders had commitments to deliver homes which required them to take delivery of lumber at almost any cost to meet their obligations. This has contributed to lumber skyrocketing by almost 400%. In general, builders have been able to pass on these costs to buyers but now they are taking a pause and, so the writer believes, are buyers. This could be the first sign in the economy that the cure for high prices is high prices. It either stimulates new supply or curtails demand.
Builders adapt quickly to market conditions, and the landscape now is different from January. There have been anecdotal reports of some builders deciding to pause or slow down rather than continue to operate in a market with such high prices. Those stories were backed up by some hard data in the April housing starts report, which showed that single-family starts for the month were at their second-lowest level since last August. The only lower month was February when Texas was in a deep freeze.
Lumber prices are starting to respond to the pause. The July lumber futures contract has fallen by 25% from its May 7 peak, a sign that the market has found a level where buyers are balking rather than continuing to pay up. And for the first time since buying surged last spring, the inventory of homes for sale has increased for two consecutive weeks, a sign that normal seasonality might be returning.
Existing home sales, while still quite strong, have dropped for three consecutive months. This may have more to do with constrained inventory versus a drop in demand, but we will know more over the next few months if higher prices are having an impact on demand.

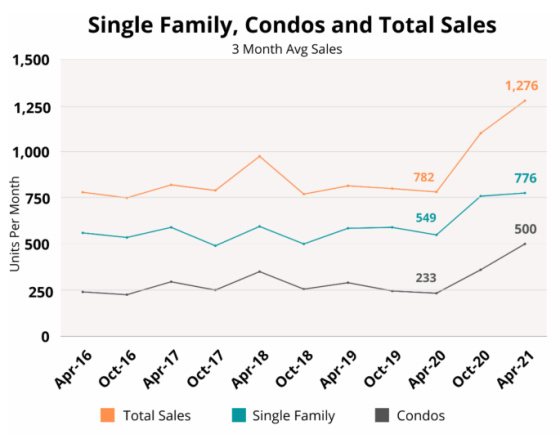
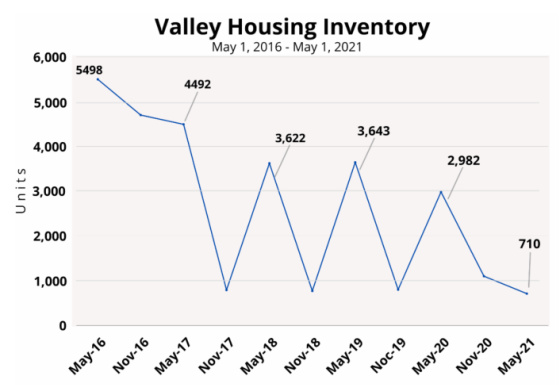
Sometimes a specific example can be nicely representative of what is going on more generally. I get periodic emails from a real estate agent in the Palm Springs area of California and these are two charts showing just how incredibly strong the housing market is there. Sales are up about 50% while inventory is down about 75%.
One can see that prices have increased significantly over the last year and yet in some cases, particularly for attached homes, they are still below their 2006 peak. It shows the importance of not buying at bubble peaks, especially if you don’t have a long ownership horizon.


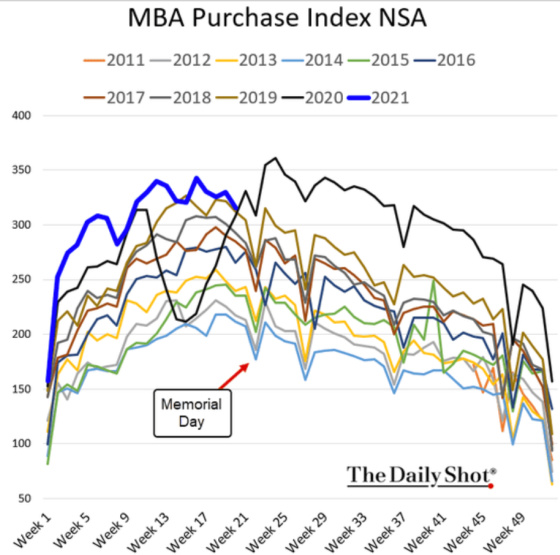
Nationally, the purchase market is holding up strong but, perhaps as the Bloomberg writer is noticing, maybe we have hit a peak and we will see a deceleration from here as the previous reference to existing home sales falling may be corroborating.
The stock market seems to be pricing in a lessening of strength for homebuilders as this chart shows (assuming this is the correct interpretation).

What other things am I looking at besides housing that might suggest inflation is transitory?
One area relates to the Fed and the release of the minutes from their last meeting that started the topic of tapering its bond purchases. The market immediately responded by lowering its inflation outlook as the following chart shows.

A less accommodating Fed is perceived to be a disinflationary force.
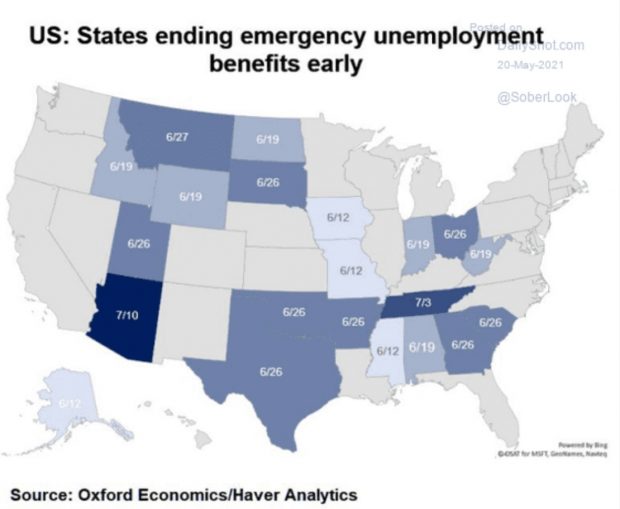
We’re now going to see some states start to cut back on unemployment benefits. This will presumably take away some buying power in the economy and curtail demand for some goods and services.
A recent study suggests that eliminating this benefit will impact consumer spending.
Eliminating the $300-a-week benefit “may increase the rate of job-finding somewhat, although states that eliminate the payments may see somewhat slower growth in consumer spending, and possibly slower hiring as a result of the reduction in disposable income,” they said.
Indeed a separate report, published in August and updated two months ago, found that total spending in 15 Illinois counties declined by 5% when federal benefits were cut to $300.
Honestly, with this next chart, I’m taking it at face value because I don’t have access to the research report explaining how they have calculated the trajectory of excess savings. Assuming they’re correct, however, then this would seemingly be disinflationary unless these savings are unleashed via massive spending, which I don’t think is the case or will be the case.

And even if the trajectory results in less of a savings drawdown, it appears from this chart from the Wall Street Journal that the bulk of the savings is with high-income people who will have more of a demand to invest than spend so this will probably be more supportive of asset markets than be inflationary from a goods and services perspective.

And we’re seeing people pay off their credit card balances quite significantly which is showing a propensity to save versus spend. On the other hand, this may create future buying power through enhanced borrowing capacity now that credit balances have dropped quite significantly.
Finally, in spite of 10-year Treasury yields having risen materially from their Covid bottom, they are still nowhere near the previous cycle high of approximately 3.00%.
If investors were worried about inflation in the long run they would want to be compensated more for this risk via higher interest rates. Right now this is not the case.


Gary,
Agree on housing prices. My wife Julie is a Realtor. She is seeing signs of a pushback on pricing.