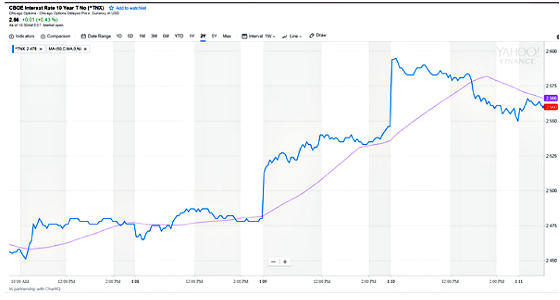
What a difference a week makes. Last week I wrote about how the Fed starting to unwind its balance sheet shouldn’t cause us much worry in terms of triggering a meaningful increase in interest rates. Of course, yields spiked higher over a few days to seemingly contradict my sanguine outlook. Here is a five-day chart showing how yields spiked (at least temporarily).
Investor sentiment has turned quite negative as the following headlines depict.
The Bond Bloodbath Begins

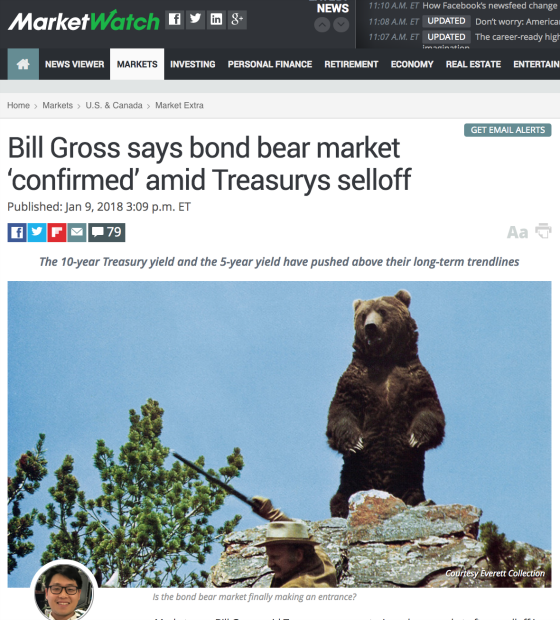

It seems like every time there is a spike in yields there is a chorus of naysayers who declare this the final end of the 36-year bull market yet again. Bill Gross declared this last week and Jeffrey Gundlach said that if 10-year Treasury yields breached 2.63% then he would become a bear as well.
As variable rate borrowers, we at CWS are by default bullish on interest rates staying low. As a result, I definitely have a dog in this hunt. So what do I do when I feel my emotions start to elevate when I feel the world is conspiring against how we are positioned? I take a deep breath and turn to history and math to help me put things in perspective.
I decided to go back to late 2011 to look at the previous higher rate cycles and how the current increase in 10-year yields compares to the previous four rate increase cycles. I chose late 2011 because I wanted to look at how rates moved after the Great Recession and during a time when they have been hovering in a range of between 1.50% and 3.00%, which is where I think they will probably continue to be over the next five years or so. The following chart shows how 10-year Treasury yields have oscillated since 2007.

One can see that there has been a trend of lower highs and lower lows, although it has flattened out over the last few years generally speaking.
The following table shows the key variables for these rate increase cycles.
| Dates | Trading Days | 10-Year Low/High/Change | 2-Year at 10-Year Low/Spread | 2-Year at 10-Year High/Spread |
| Sept. 22, 2011 – March 19, 2012 | 121 | 1.72%
2.39% 0.67% |
0.20%
1.52% |
0.39%
2.00% |
| May 2, 2013 – Dec. 31, 2013 | 167 | 1.66%
3.04% 1.38% |
0.20%
1.44% |
0.38%
2.66% |
| Feb. 2, 2015 – June 10, 2015 | 91 | 1.68%
2.50% 0.82% |
0.49%
1.19% |
0.75%
1.75% |
| July 7, 2016 – March 14, 2017 | 171 | 1.37%
2.60% 1.23% |
0.61%
0.76% |
1.40%
1.20% |
| Current
Sept. 7, 2017 – Jan. 10, 2018 |
85 | 2.05%
2.59% 0.54% |
1.40%
0.65% |
1.98%
0.61% |
One can see that the current move in 10-year Treasury yields has been mild relative to past moves so this may mean there is more to go. It’s also been of a shorter duration which speaks to the potential of yields moving higher. Investors are understandably focused on whether the 10-year will close above 2.60% which would be a higher high for the first time since the taper tantrum of 2013 when the Fed first announced it would begin tapering purchases of Treasuries and mortgage-backed securities. Everything about that move looks like an overreaction in terms of how much yields went up so I think there are fewer comparisons to now. On the other hand, one could argue that maybe it is more comparable since the U.S. is starting its balance sheet unwinding, the ECB may be heading in that direction, and there are indications that the Japanese central bank may remove some accommodation. Nevertheless, I think the Fed learned its lesson about communicating major policy changes more effectively so we probably won’t see such an aggressive move higher in rates.
We can also turn to sentiment indicators for some guidance. According to this index from Sentimentrader.com it looks like we have reached the peak of maximum bullishness in this mini cycle and now bearishness is taking hold very quickly and it looks to me like we could see rates have a higher probability of going down versus up in the short run.

This next chart shows the positioning of hedgers who are deemed to be the “smart money.” They have become more bullish as rates have risen which is another positive in terms of 10-year yields moving lower.

The data for these two charts is through January 9th, 2018 so it will be interesting to see what happens when the next report comes out based on data through January 16th now that rates have settled down a bit. January is also a seasonally strong month for 10-year Treasuries so there may be another tailwind for pushing yields lower in the short-term.
To bring another variable into the equation, the following chart shows hedgers’ position in crude oil.
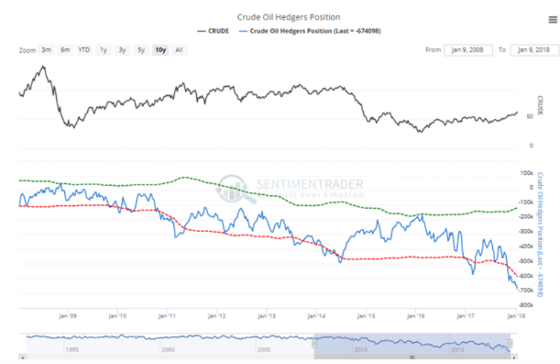
Oil has had a very nice rally, along with most commodities, largely due to the weakening dollar and global synchronized growth. To me, it looks like we’re in need of a reversal of some of these gains and if this occurs and oil corrects, then this will reduce projected future inflation rates priced into yields by bond investors which should also be supportive of lower yields.
Now let’s throw out everything about what I just said about how yields are positioned to go lower and ask how high can yields go in this cycle? If we assume that the taper tantrum was unusual in how aggressive the market’s response was because of the surprising nature of the announcement, then the 10 minus 2 spread increased by approximately 50 basis points on average, exclusive of that cycle. Interestingly, in the current cycle, the spread has compressed, which is pretty unusual. The average increase in 10-year yields has been about 100 basis points. So if I’m wrong about bonds rallying in the short run, then these two points to yields potentially going 50 basis points higher over the next three months or so, although I would be surprised if they breached 3.00%.
Bond Armageddon
Back to the week in the life of schizophrenic bond investors. What happened to ease the dire predictions of a Bond Armageddon? The Treasury auctioned 10-year notes on Wednesday and it turned out the demand was extremely high as the following chart shows.

This helped cool bearish sentiment and more bulls (or less scared bears) came into the market and they were additionally aided by China denying that it said it would not buy Treasuries for the time being. The following headline shows how some traders think bears are off base and materially higher rates are not something to fear.
This is what some traders and investors interviewed by Bloomberg had to say: Even Bill Gross tempered his pessimism regarding U.S. Treasuries.
It didn’t last long: 10-year Treasuries erased earlier losses to trade nearly unchanged by day’s end, thanks to a $20 billion auction of the notes that drew the strongest demand since 2016. It provided traders with a firm signal that buyers will still turn out at the right price in the world’s biggest bond market. Positioning data to be released Thursday may give a hint as to whether traders were confident enough to wager on a further rally from current levels.
Even Bill Gross, the Janus Henderson Group fund manager who called the start of a bear market this week, is skeptical of how much damage can be done in the $14.5 trillion Treasuries market. He said Wednesday that he doesn’t foresee dramatic losses. In fact, he expects the 10-year yield may only rise 15 to 25 basis points more by year-end.
“The bear market that I’m talking about is a mild one,” Gross said in a Bloomberg Radio interview. “I don’t think we’re headed for investment Armageddon.”
To summarize: I think that over the next two months rates have a greater chance of going lower versus higher and that if 10-year rates do rise then I don’t see them breaching 3.00% before turning back down again.
We shall see what happens but right now I’m still keeping calm.
Leave a Reply