
The unemployment rate is the most important indicator for people who are believers in the Phillips Curve. Phillips Curvers believe that there is a trade-off between unemployment and inflation. The less slack in the labor markets (lower unemployment rate) the more inflation there will be as labor can bargain for higher wages and this, in turn, can lead to increased demand via more purchasing power and correspondingly higher prices absent more supply. That seems to be the key assumption: Supply doesn’t keep up with demand. When looking at the unemployment rate in the following chart, one can clearly see that it has dropped significantly over the last six years to a very low level.

And yet, the Fed’s favorite inflation measure, Core PCE, which strips out food and energy due to their volatility, has remained quite low.

And even putting food and energy back in it’s still below 2% and has been on a downward trajectory.

And all other indicators of inflation are dropping as well as the following chart shows.
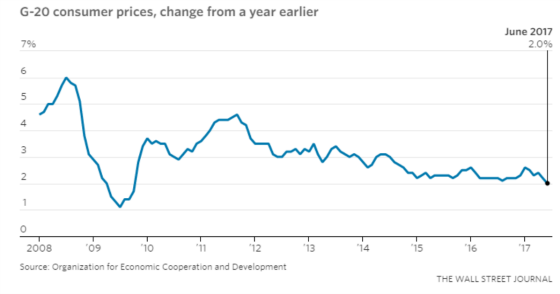
Declining inflation rates isn’t just a U.S. phenomenon, it’s global as well as the following chart shows.
So why are we seeing such low inflation readings in the face of low unemployment?
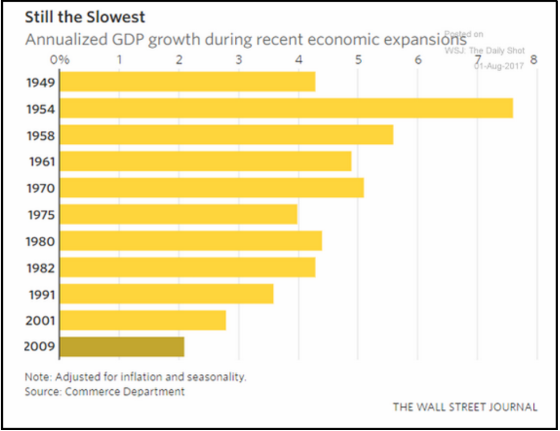
Perhaps it’s because we have experienced such a muted recovery in terms of growth as the following chart shows.
The manufacturing sector has recovered nicely since the downturn and has grown slowly but steadily over the last five years as the following chart shows.

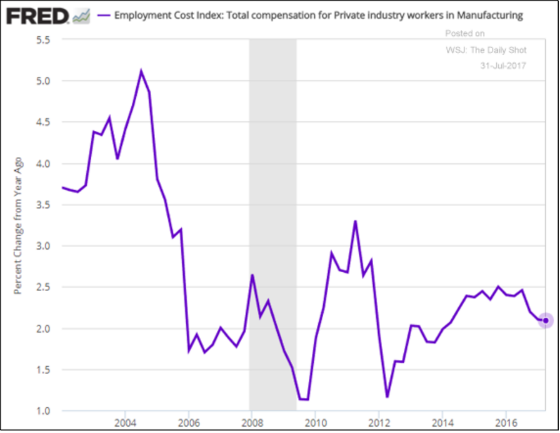
And even in the manufacturing sector wage growth has not been very strong despite employers expressing some concerns about finding qualified labor.
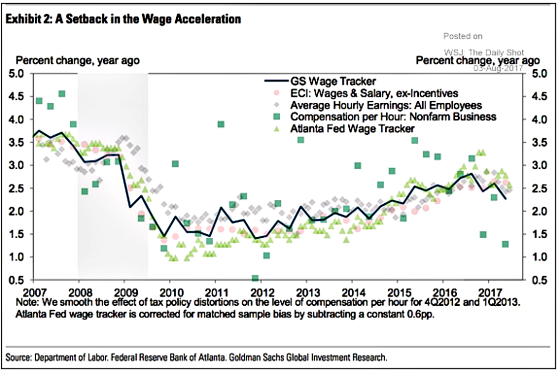
And on a more widespread basis, wage growth seems to be decelerating.
From an apartment owner’s standpoint, however, the age cohort with the highest propensity to rent, 20 to 34-year-olds, is showing accelerating wage growth which is a good sign. Older Americans, on the other hand, are seeing their wage growth compress.

So why haven’t the adherents to the Phillips Curve seen higher wages in the face of what looks like very low unemployment? Gary Shilling has been someone I have followed over the years and he has done a good job pointing out fallacies in the consensus and where risks and opportunities may lie for investors. He recently wrote a two piece series on why the unemployment rate is misleading on Bloomberg.
He gave the following six reasons for this.
- Globalization
- Global labor supply and machines
- Surplus U.S. labor as evidenced by the bottoming of the labor force participation rate
- Shift to lower paying jobs
- Declining union membership
- Productivity
Global supply chains make a number of American workers having to compete with labor from overseas. And when automation is added in, there are labor saving options for employers which can continue to keep the bargaining edge with firms over workers. Despite lower headline productivity growth, there is no doubt that more technology is being created that over time should be adopted in many industries which will lessen the need for certain categories of labor.
The Fed has telegraphed the potential for one more interest rate increase this year but the market is skeptical due to weak inflation numbers and wage growth. The following chart shows that investors are assigning a 38.7% chance of a December rate hike.
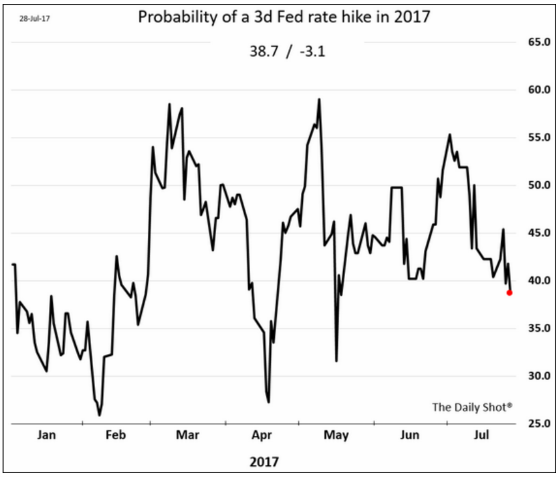
Of course, the odds can change quickly but I would argue there are some headwinds the Fed will have to contend with before pulling the trigger. The first is the implementation of starting to wind down its balance sheet by not reinvesting the repayment of maturing Treasury securities and mortgage-backed securities up to $50 billion per month. No one knows what that will do to interest rates and financial conditions. There’s an argument that it could actually lead to looser financial conditions while Fed Governor Lael Brainard is in the camp of waiting to see the effects of balance sheet reduction before increasing short-term rates again.
The more on the ground challenges relate to a slowing in the economy as measured by a few different indicators.
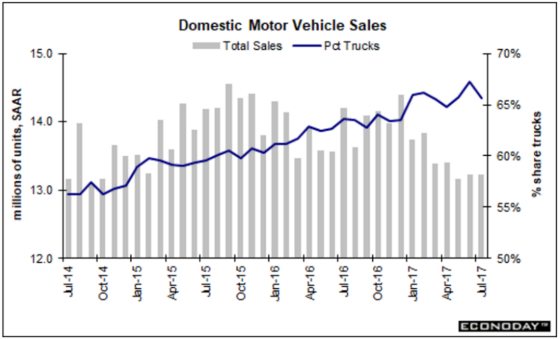
The automobile sector is hitting the brakes as vehicle sales are dropping and profitability is being maintained higher than it otherwise would be due to the growing share of SUVs and trucks being sold.
This has led to a slow rate of growth among banks with regard to auto loans.

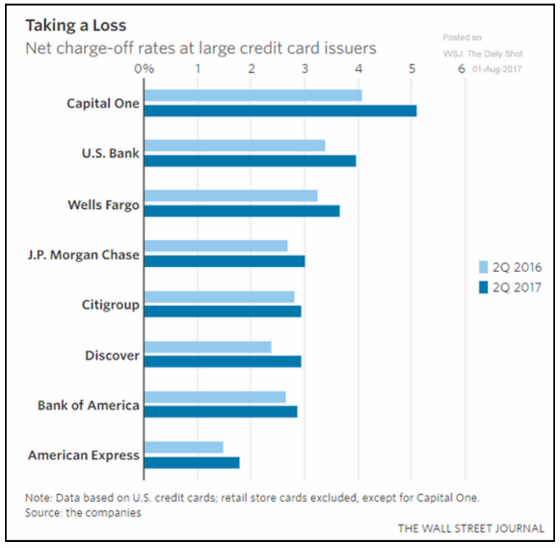
Credit card loan growth is slowing materially as well.
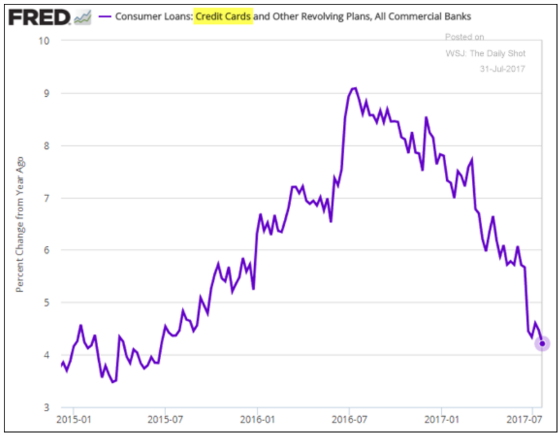
I would expect this slowdown to continue as credit card losses have been increasing for banks which should probably lead to tighter credit going forward.
The service sector is softening a bit based on the latest reading from ISM. This is a headline from Marketwatch on August 3rd.

The last domestic chart I’m going to show is one I found to be quite telling. It tracks the growth rate in federal government receipts. Notice how closely they seem to correlate with the business cycle, which of course makes sense. When there are more profits and personal income due to more employment and/or wage growth, this should flow into the Treasury’s coffers in the form of higher income, payroll, and corporate taxes. We have already gone slightly negative with the trajectory now slightly positive. If history is any guide, then we should already be in a recession by now. On the other hand, this has been an unusual cycle in that the length of it has been quite long while the cumulative growth quite small. As a result, we don’t have the excesses built up like we have had in other business cycles so maybe this one can keep going a while more despite very slow growth in federal government receipts.
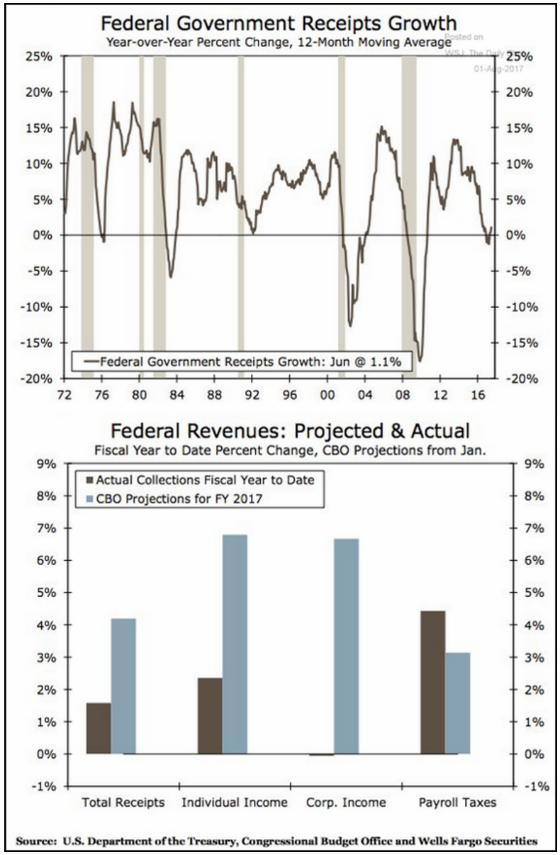
It is interesting to see how far off receipts are from what was projected for individual and corporate income taxes while payroll taxes are doing better than projected. Are we now at the point where labor will claim a greater share of the economic output despite relatively subdued wage growth?
Finally, I often like to turn to Japan as the canary in the coal mine in terms of what it might be foreshadowing for the United States. The following chart shows how acute labor shortages are in the country and which industries are most challenged.

And yet, like the United States, it has no material inflation to speak of as the following chart shows.

So what gives? I think it comes down to demographics. The Japanese population is aging rapidly and its overall population has begun to shrink with the working age population shrinking even more rapidly as the following chart shows.

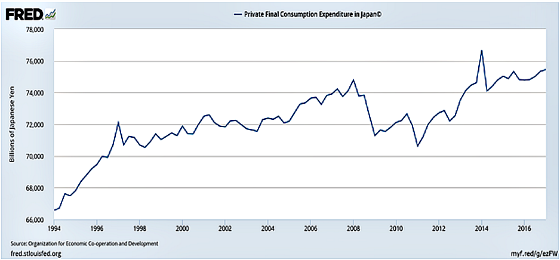
It’s not surprising that labor shortages are materializing given the shrinking working age population. But with the country aging, older people tend to spend less money and save more with the exception of medical costs. The following chart shows private domestic consumption in Japan. On a nominal basis, spending has only grown by only 4% cumulatively over the past 20 years! It’s been on a bit of an uptrend recently but demographic trends will be working against this going forward. This puts pressure on companies to constrain wage growth and to use automation and other labor-saving productivity enhancements to preserve its profitability and to contend with labor shortages.
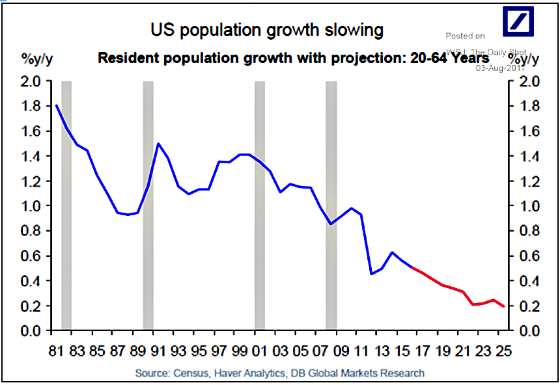
If we turn back to the United States, we can see that the working age population trends are not very favorable either, albeit better than Japan’s as we are still projected to grow.
Count me out of the camp of the Phillips Curve adherents. I still see interest rates staying lower for longer despite the unemployment rate being at historically very low levels.
Over to You:
Which side are you on?
In addition to Gary Shilling’s and your well taken points, the “headline” unemployment rate (“U-3”) is deceptive as it excludes discouraged job seekers and counts part timers as fully employed. “U-6” is more accurate and stands at 8.6% suggesting plenty of available workers (though many possessing mismatched skills one would assume).
What a wealth of information you have collected. I’m impressed and by the way, I agree with you.
Agree 110%. Globalization and technology are deflationary. Labor and capital are always in a struggle and capital has won the last 30+ years. We’ve had inflation but it’s asset inflation and capital has become expensive in almost all asset classes. The returns on capital are the source of inequality if you believe Piketty.