
Last week I discussed the possibility that housing could be the canary in the coal mine with regard to an important area of the economy starting to be impacted by higher prices. I wanted to go more in-depth with many more housing-related charts and then end with one non-housing chart that I think trumps everything else in terms of why I think the Fed will remain on hold in terms of raising rates.
Rising home prices are not just a U.S. phenomenon, but a global one as well as the following chart shows.
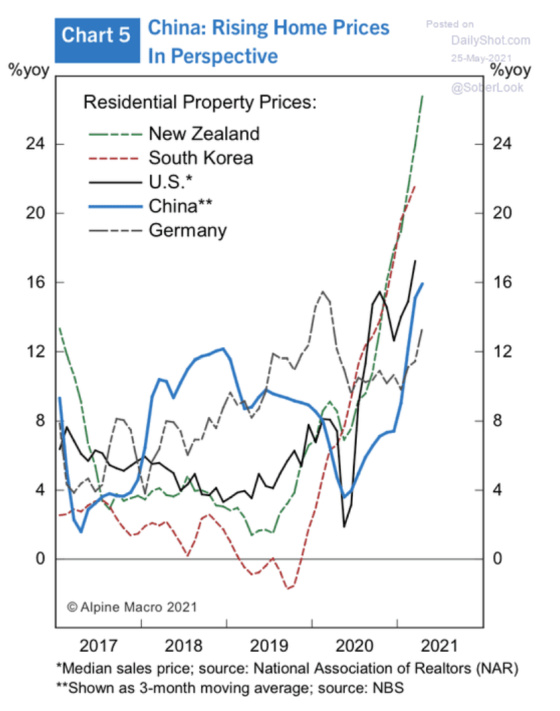
Since the focus of this blog is on the United States, the remaining charts will be based on domestic housing data.
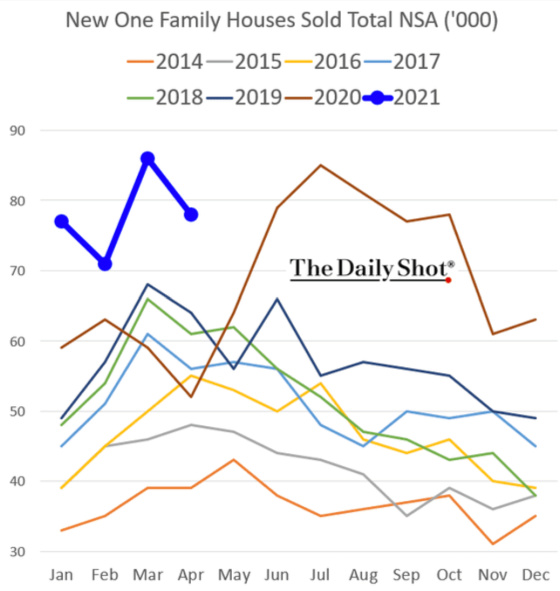
Although new home sales were revised downward fairly significantly, they are still quite a bit above previous years. The real challenge will be in the summer when the comparisons become more difficult since this is when the housing market started heating up in 2020.
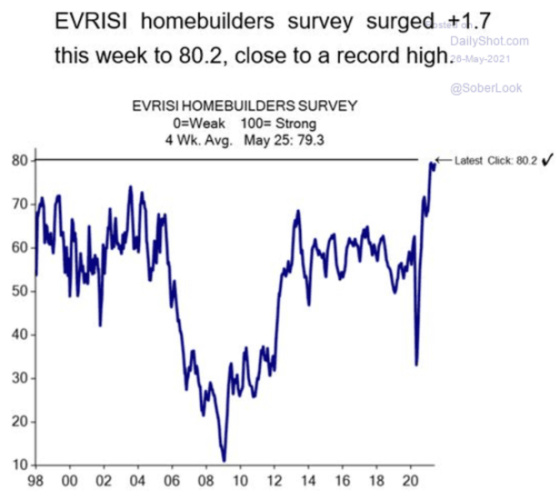
Not surprisingly this has made homebuilders extremely positive about the market for new homes. The following survey shows that optimism is at a record high.
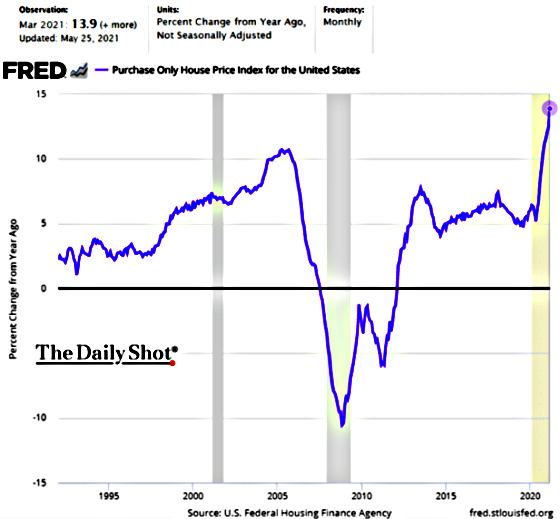
The following charts show how homes in major metropolitan areas and in the country overall have been appreciating quite rapidly over the past year.
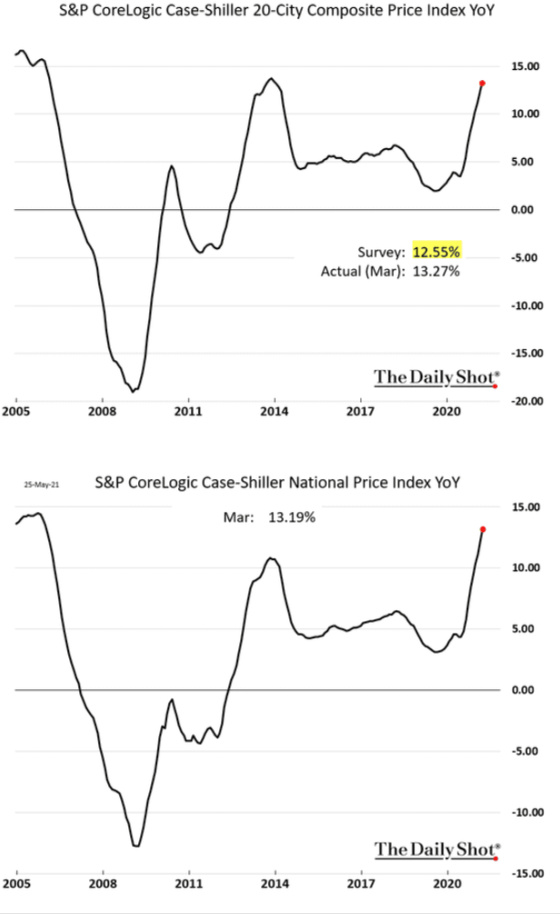
This is another price index that corroborates the strong appreciation that has taken place in the home resale market.
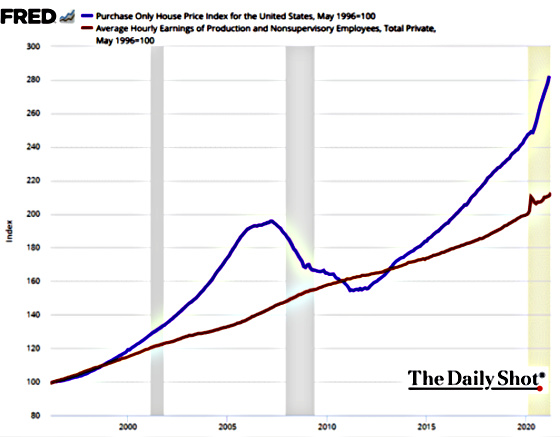
The cumulative rise in home values has significantly outpaced wages and is now at a similar premium as it was in 2006-7, during the peak of the housing bubble.
One offset to home prices being significantly higher than wages is mortgage rates which have dropped quite significantly. This has enhanced the buying power of home purchasers in spite of wages not keeping up with home prices.

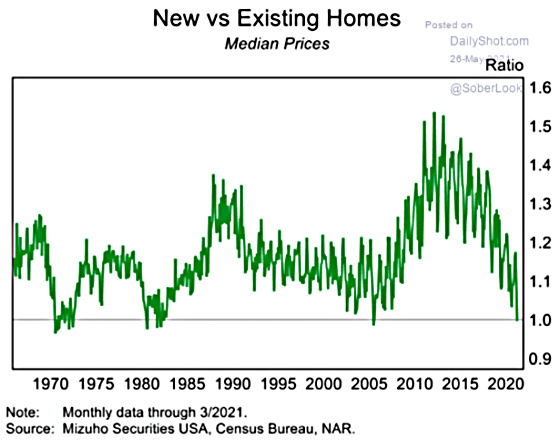
The strong demand for resale homes, along with lower mortgage rates, have pushed prices higher such that there is no material difference between the cost of a new home and a resale according to this chart. The last time there was such a narrow gap between the two was during the housing bubble that peaked in 2005-7. This should make new homes even more desirable because buyers do not have to pay a premium for purchasing something new. With that being said, however, the cost of materials, particularly lumber, has increased dramatically so builders will have to raise prices if they want to keep their profit margins so this gap may widen again.
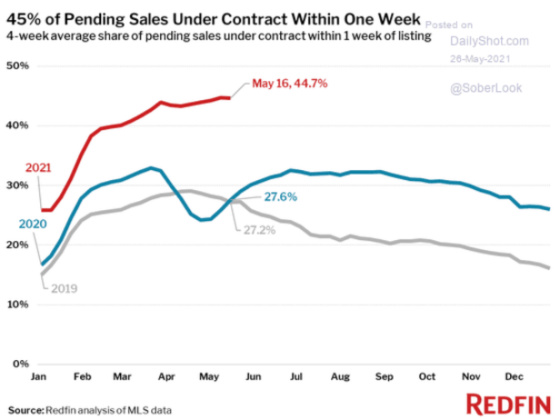
With the lack of inventory for sale, it has been extremely challenging for buyers to put homes under contract to purchase.

Given the short period of time homes are on the market, the percentage of homes put under contract within one week of being listed has increased substantially to approximately 45%.
So now the question one needs to ask after seeing the next two charts is do we pay more attention to what people do or what they say? Obviously, people have been purchasing homes at a very strong pace. At the same time, the charts above show that there is tremendous competition to purchase homes so a lot of people are frustrated at not having purchased a home. Thus, one could interpret the survey results of the next two charts as sour grapes and frustration of not having purchased a home or feeling like one will never be able to afford one, or a true sea change in the intention of consumers to purchase a home. If it’s the latter, then we may be in for a demand shock as buyers rebel against much more expensive homes.
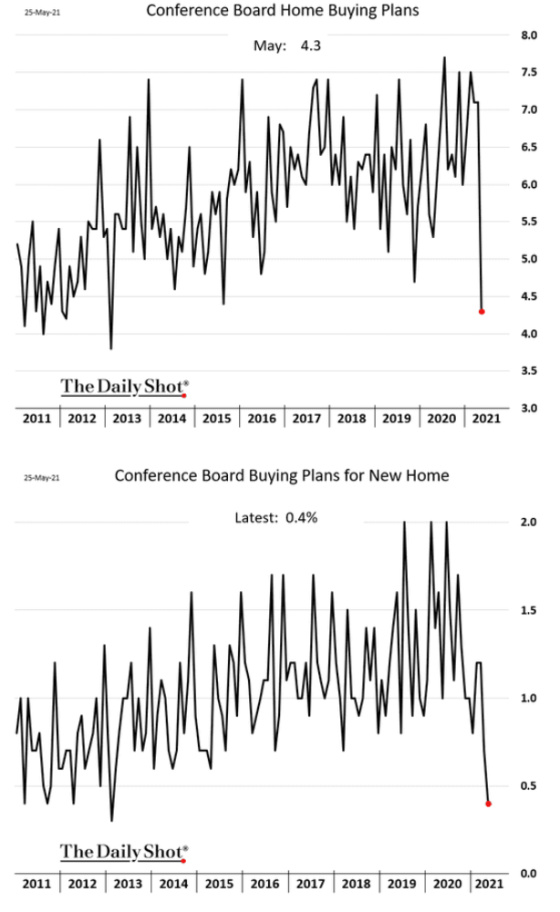
Here is another chart showing that buyer hesitancy has increased significantly over the last month.

And while there are a number of people who are understandably concerned that the Fed is inflating asset markets with its loose monetary policy, especially in conjunction with tremendous fiscal stimulus, the Fed doesn’t seem to care as it is laser-focused on Main Street. I believe this next chart is what will keep the Fed on hold in terms of raising short-term interest rates pursuant to what it has publicly stated, which is at least through 2023.
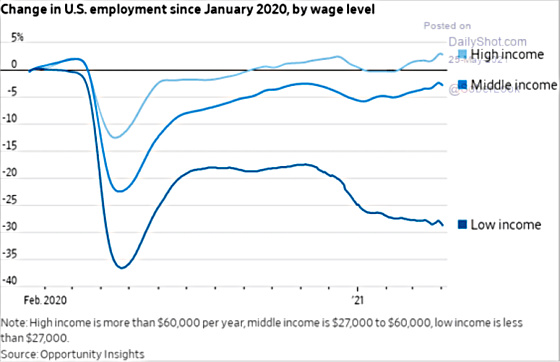
Low-income jobs have been decimated in the pandemic and once unemployment benefits start getting cut then we will see how much of a labor shortage there truly is as the incentive for taking a lower-paying job will have risen quite significantly.
I don’t believe that we are facing any material risk of home prices collapsing as they did after 2007 because loan quality is so much higher and buyers are putting more money down and there is very little distress in the system creating large numbers of forced sellers. In addition, the skyrocketing cost of materials, as well as labor challenges, has unequivocally made it more expensive to build a new home which should also keep a floor under home prices. I do think, however, that we could see prices flatten out as prospective buyers start to think twice about paying these prices, particularly with inventory being so low. These high prices should theoretically stimulate more people to put their homes on the market which should allow for a better balance between supply and demand. Demand is also particularly sensitive to mortgage rates since home prices are at a significant premium relative to wages.
Happy Memorial Day and thank you to everyone who has served our country. We are deeply indebted to you.
Well said Gary, like your macro approach as you know mine is a bit more focused on OC and Tustin area via tustintalk.com. Classic catch 22 for the Feds, can’t raise rates too much and implode things, meanwhile it’s fueling housing and prices are skyrocketing. Once rates do begin to rise, I agree with you it looks like stabilization of pricing will take place. There is so much demand relative to supply, locally we are at about 1/3 inventory and about 10% higher one demand (pending sales) than historical averages. Crazy times, keep us the good work.
Thanks for this Blog Gary. I had been hoping you would cover this topic.
We made the decision to take our money and run on some of our rental property in the last few months & have been debating what to do with the proceeds of the sale! This article has, as usual, given us something to think about!