
The answer? See for yourself, is it inflation or housing or both?
If Google Trends are any indication then inflation has been a top-of-mind topic.
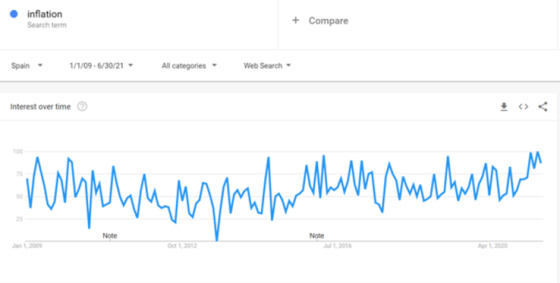
CPI – Consumer Price Index
This is not surprising as one has to be a survivalist living far away from civilization and fully self-sufficient to have not been impacted by rising prices and slower delivery and service times.
Median CPI takes the midpoint of all of the price changes calculated by the Bureau of Labor Statistics. One can see that it is quite elevated which means that higher prices are fairly well dispersed.

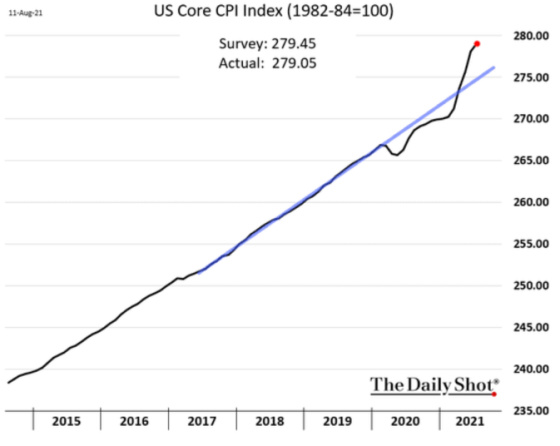
Core CPI, which strips out food and energy, is now well above its historical trend after being below it for 2019 and 2020. This is not surprising given the impact of Covid during that time.
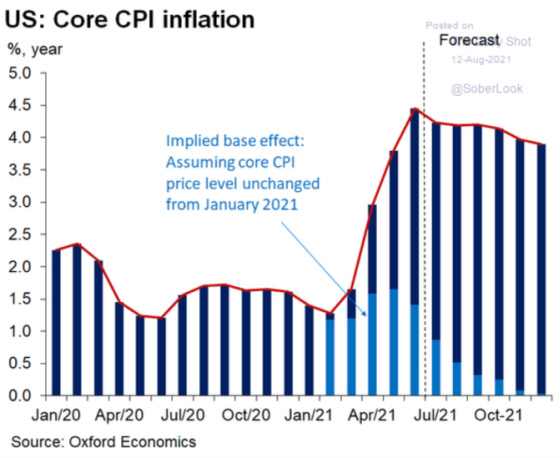
The forecast for the next few years is for Core CPI to remain elevated for the rest of 2021.
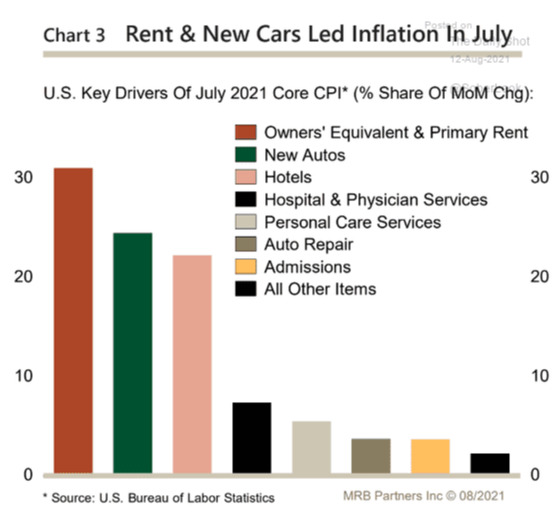
From an inflation standpoint, many roads seem to be leading to housing. A meaningful percentage of the increase in the core Consumer Price Index is related to housing as the following chart shows.
The next charts show the increases in two housing sub-indexes used to calculate CPI. The first one is based on surveying renters and asking them how much they are paying in rent based on the following question.
“What is the rental charge to your [household] for this unit including any extra charges for garage and parking facilities? Do not include direct payments by local, state, or federal agencies. What period of time does this cover?”
One can see that the rate of increase is on the lower end of the last four years from a renter’s perspective.

The second chart is based on what owners believe they could rent their homes for based on the following question:
“If someone were to rent your home today, how much do you think it would rent for monthly, unfurnished and without utilities?”
One can see that the recent increases in this index are on the higher end. It is interesting that this index is based on estimates of a home’s rental value whereas the previous index is based on renters reporting on what they’re actually paying.

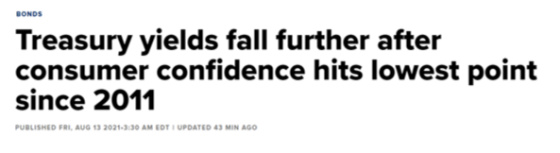
Before I look at some forward-looking housing indicators I wanted to show how bond market investors don’t seem to be too worried about inflation and the Federal Reserve tightening materially, particularly after a dismal consumer confidence report.


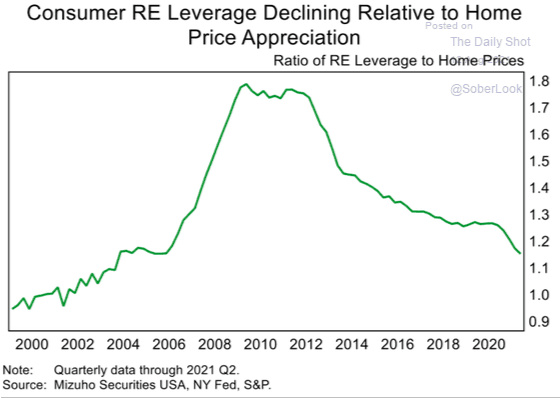
Now back to housing. With the significant appreciation in home values, homeowners have delivered their loans as a percentage of market value is approaching levels where they were before the housing bubble exploded. The ability of homeowners to tap into home equity should be a tailwind for the economy.
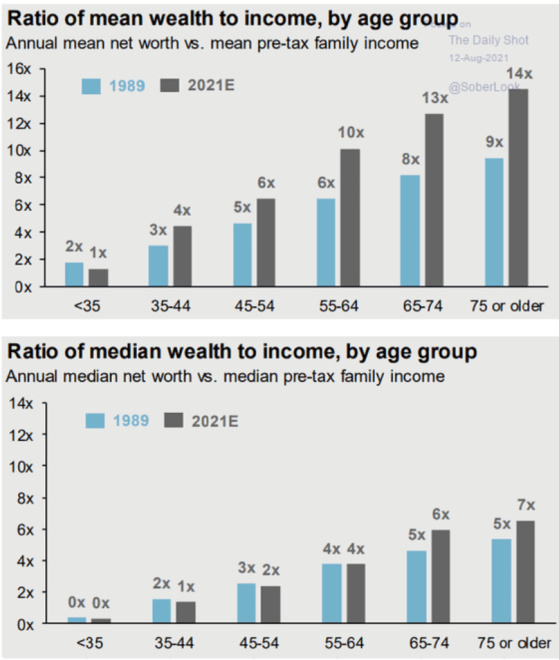
The massive appreciation in home prices and the stock market, as well as other asset classes, have ballooned net worth relative to incomes, particularly for the very wealthy as the mean ratio is much higher than the median.
Household formations are projected to grow meaningfully over the next four years which should keep the demand for rentals and purchases strong.

With demand healthy, there should be a huge incentive for builders to deliver new homes to supply that demand. The following chart suggests this is going to be a very big challenge for builders to do so over the next few years.

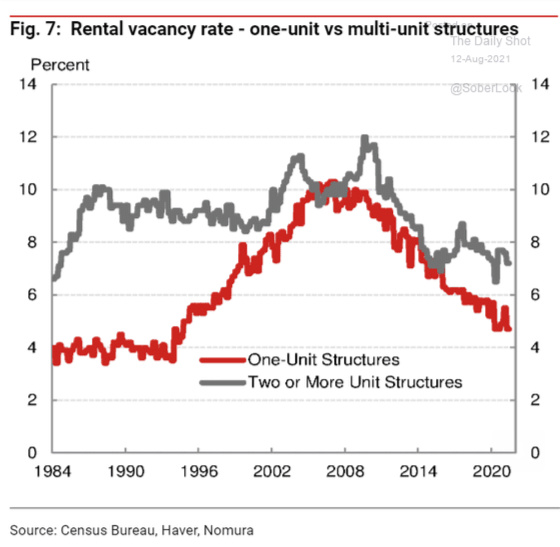
As I discussed in last week’s post, the rental market is quite strong and getting stronger. Vacancy rates have been dropping and I would expect these to drop further.
It would appear that housing will feed into CPI to keep it somewhat elevated unless overall prices rise to the degree that it begins to curtail demand, proving the old adage that “the cure for high prices is high prices.” Perhaps that is why consumer sentiment has dropped so significantly. I don’t see a correction in home prices and rents so there may be other areas of the economy that might have to have some of the air taken out of it such that overall CPI over the next few years starts coming down back to more historical 2% or less levels.
Leave a Reply