
Mark Twain once said, “I didn’t have time to write you a short letter, so I wrote a long one.”
When writing (and speaking) it’s fairly easy to let the words flow without much regard to precisely communicating. If one gets into a stream of consciousness state it can be helpful for the writer and speaker to release what’s welling up inside but this may not be what’s best for the reader or listener in terms of communicating clearly, efficiently, and effectively. To do this requires a lot more time as it necessitates a significant amount of editing and re-reading (or practicing) to pare down what is being communicated so that the most important points are conveyed in a way that their essence is readily absorbed.
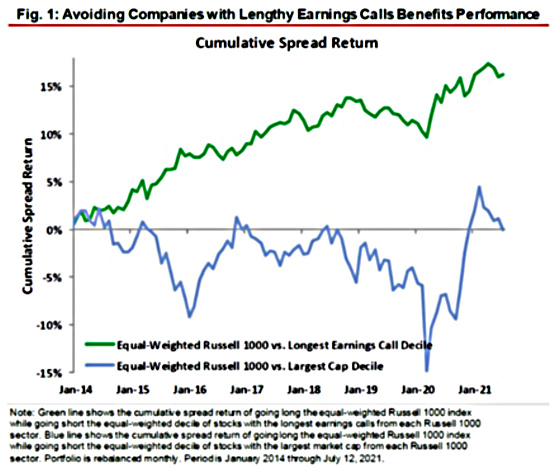
It turns out that inefficient communication has a correlation with companies producing returns in the stock market that underperform the averages. I learned about this from one of my favorite writers at Bloomberg, John Authers. He oftentimes will add some miscellaneous thoughts and interesting items at the end of his very thoughtful and well-researched opinion pieces. This is what he passed on to his readers last week.
It’s always great when machine learning and big data crunching confirm basic common-sense intuitions like this. And thanks to Nomura Instinet, we can say that it does. Nomura quantitative strategist Joseph Mezrich, let loose on a trove of corporate earnings call transcripts, tested for a simple variable: How did the length of a call affect subsequent performance? The result was emphatic. Over the last seven years, the average stock outperformed the 10% of companies whose earnings calls dragged on the longest by a cumulative 15%
I have a tendency to write long posts when I don’t focus on communicating through charts. Sometimes there are topics that can be more complex that need a longer explanation, or maybe that’s what I need to do to gain clarity. When it comes to communicating with investors we like to convey our thought process and why we have made the decisions that we have so they understand the basis for our investment strategy more generally as well as for specific properties. Real estate is a byproduct of many different forces (e.g. demographics, job trends, affordability, consumer preferences, interest rates, financing terms, etc.) so we have to integrate a lot of variables to come up with our high conviction investment ideas, and then we have to communicate our reasoning in a way that resonates with prospective investors such that they understand the rationale, risks, rewards, and investment objectives in order for them to feel comfortable that the investment is suitable for them. We want to apply Ockham’s Razor. We want to be as simple as we can without being too simple that the essence is missed.
I do think it’s interesting that there’s a correlation between underperformance and loquaciousness. Perhaps it’s because there are many problems in the business or it’s a relatively complex business so the variability is higher as compared to less challenging, simple ones. Both situations can lead to less succinct communication. Perhaps the management team is not very well prepared for their calls and this detracts from investors’ confidence that they know how to run their businesses effectively and have a good grasp on it. Who really knows but it does appear that more is less when it comes to management communication and stock price performance.
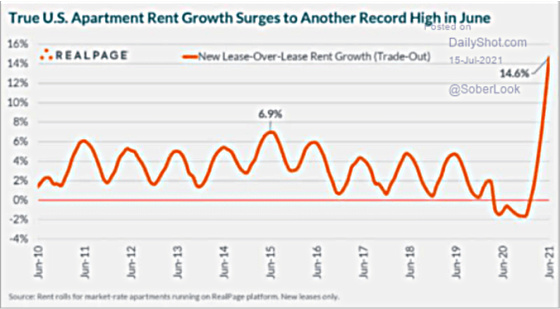
So in an effort to remain brief and communicate succinctly, here are a few charts that convey how the apartment market is starting to recover quite impressively, which is something we’re seeing in our portfolio as well.
There is a big increase being paid for new residents signing leases as compared to those who are leaving.
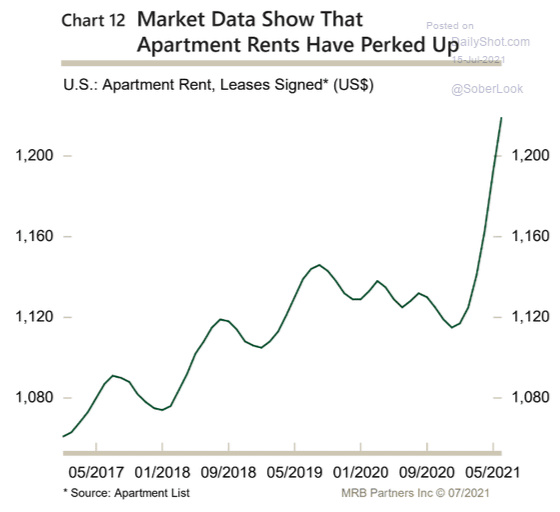
Demand has grown significantly as evidenced by the number of leases being signed.
With supply and demand much more in balance, the development pipeline continues to remain robust as apartment developers try to meet the demand by creating new units.

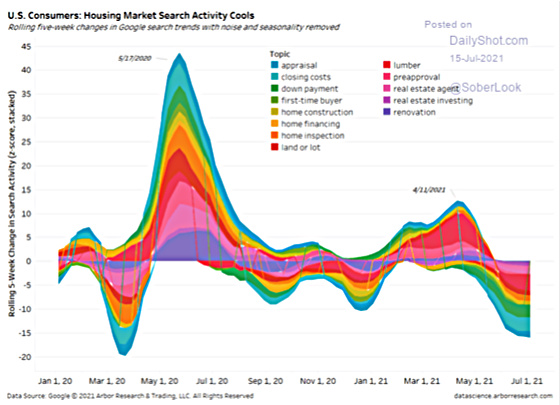
And it does look like the housing market may be cooling ever so little as conveyed by these charts.
Purchase financing has slowed down fairly materially but is still at healthy levels.

Search activity has cooled materially.
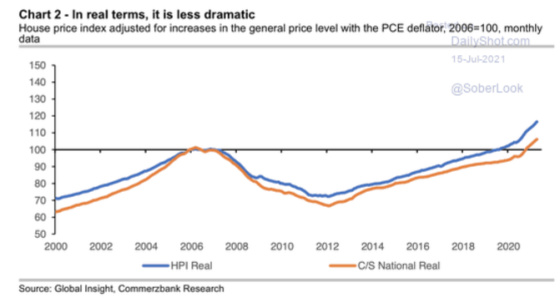
Prices are still below 2006 peak levels when adjusted for inflation.
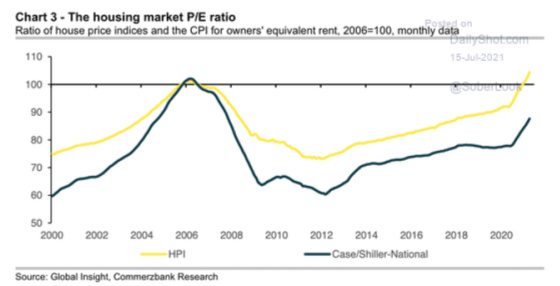
And from a price/earnings multiple standpoints, home prices are still below where they were in 2006 based on one index but have now exceeded that level based on another one.
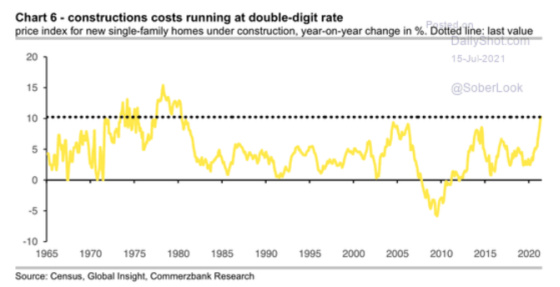
Finally, one tailwind purchasers of existing assets have is that the cost to build new homes has been escalating rapidly which makes resales more price competitive.
So there you have it. Unlike the title of this blog hopefully, you found it to be informative and to the point.
Leave a Reply