
Trite generalizations have been able to have longevity because there is enough truth in them to have proven wise and insightful. One of them is that markets go up like an escalator and drop like an elevator. Last week was a perfect example of this.
Markets go up like an escalator and drop like an elevatorClick To TweetOver the years I have been watching with some degree of interest at how investors have been increasingly sucked into betting on continued stability in the VIX (an index that measures stock market volatility) and what a winning bet this has been. Essentially investors have been writing insurance against higher volatility by shorting the VIX and/or selling futures and collecting premiums from having done so. The strategy has worked like a charm because there has been incredibly low market volatility and when it does flare up, investors have faithfully bought the dips and brought the volatility index back down with the rallies.
Unfortunately, this trade became very crowded and Wall Street, as it is so adept at doing, fed the demand for investing in the VIX by creating more investment vehicles, many of which became increasingly complex and esoteric with a great deal of leverage and risk associated with them. As often happens when there is a perception of easy money, the public gets sucked in towards the top and is left holding the bag when the smart money slips quietly out of the exits.
The catalyst for this vicious downturn was supposedly the latest non-farm employment report that showed that wages moved up at a more rapid rate than expected and convinced investors that the Fed was behind the curve in terms of raising rates and tightening monetary policy. This resulted in interest rates moving higher and breaching levels they hadn’t seen since 2014. This set off a panic in the stock market which led to an explosion in volatility as the following chart shows.
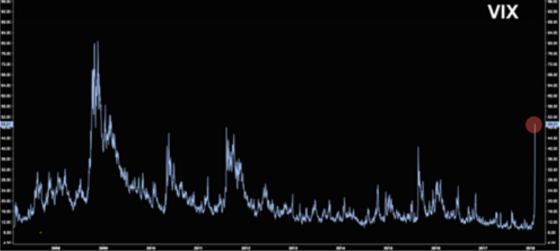
The chart above led to the complete decimation of a few Exchange Traded Notes (ETNs) that benefit from the VIX staying stable or dropping and leveraged the return so that all moves up or down were greatly magnified. The first casualty was the XIV which, to its credit, stated in its ridiculously long prospectus the following:
“The long term expected value of your ETNs is zero. If you hold your ETNs as a long term investment, it is likely that you will lose all or a substantial portion of your investment.”
The reason for the inevitable complete destruction of value is that the fund was required to liquidate its holdings after a certain percentage loss because it shorts futures contracts and theoretically its losses could be infinite so it had to set a trigger to close all short positions and wind down the fund. The termination event was triggered and now the fund is in liquidation mode.
The following chart is a classic representation of markets going up like escalators and dropping like elevators as represented by the XIV.
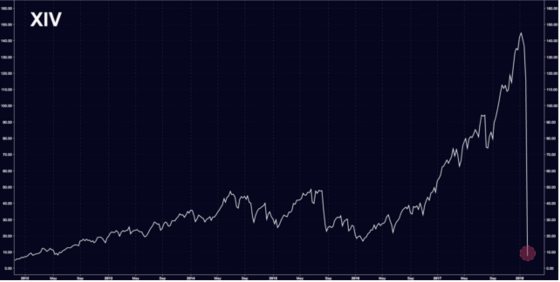
The investors were essentially wiped out overnight. Easy come easy go. This was an example of another maxim: Don’t pick up pennies in front of a steamroller. Yes, writers of VIX insurance were pocketing the premiums for having underwritten that risk and this was a possible strategy for many years. And yet, if an investment can drop like it did overnight as the chart above depicts, then one has gravely mispriced that risk. Risk is permanent loss of a capital and the returns generated over the years were not enough to compensate for the risk of being steamrolled to death while picking up pennies in the middle of the road.
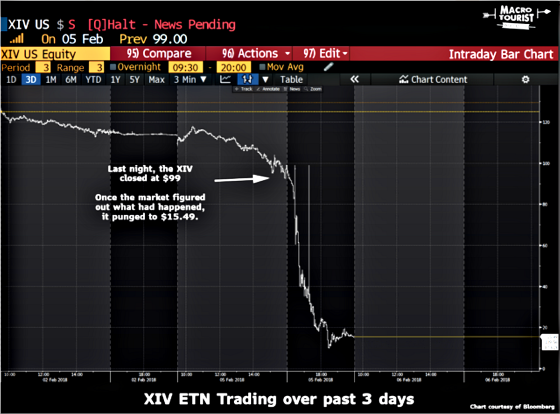
Here is a much shorter term chart showing the complete collapse virtually overnight.
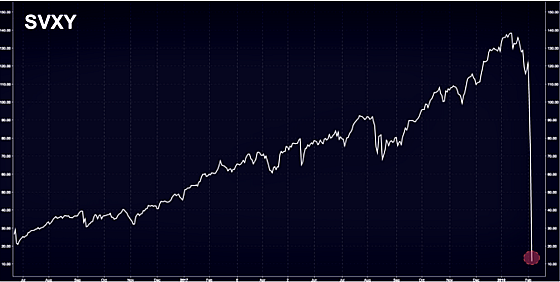
The ProShares Short VIX Short-Term Futures ETF (SVXY) followed a similar, gut wrenching trajectory.
The move in the VIX was a 13 standard deviation event. The following table shows how extreme its move was compared to other asset classes.

Rather than me trying to figure out how rare a 13 sigma event is I thought I would reproduce a chart from another event that took place in 2016 and shows the probability of each event based on the associated standard deviations (sigma).
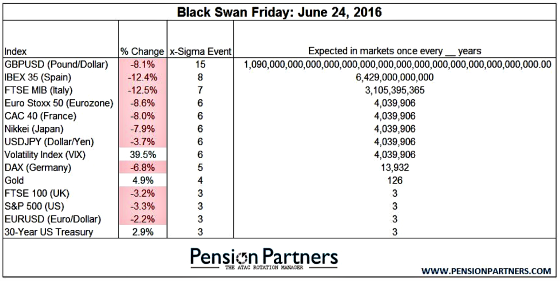
An eight sigma event should take place one time every 6.4 trillion years, let alone a 13 sigma event which I can’t even put into words to quantify it because the odds are so infinitesimally small. Look at the 15 sigma event in the table above to give you some context. It’s virtually impossible to wrap your head around it. It’s almost like you’re discussing astral distances and it should be converted to light years.
All of the above charts and tables show just how fragile the market was, especially the VIX, in that a rather mild increase in wages, which some people think may be temporary and more related to hurricane recovery, rather than something sustainable (not that this would be a bad thing), could unleash a tectonic cataclysm like we have been witnessing in the markets over the past couple of weeks.
It will be interesting to see if this is a short-term correction or something longer term and more painful.
One final piece of advice: Please avoid investing in securities in which the prospectus says that the long-term expected value is zero because one day it will be and it will occur when you least expect it and can probably least afford it.
Yikes! Brinker just sent out a message basically saying he expects a short term rally that will fail, test the bottom of this correction, at which point he says the market will be “attractive for purchase”. In the meantime he continues to recommend dollar cost averaging. At this time I do not think he claims to know the bottom.