I hope everyone had a wonderful Thanksgiving. I’ll pivot back to Jay Powell and the Fed from Pete Townshend and The Who. Two of my favorite subjects 🙂
The minutes of the Fed meetings that took place November 1-2 were released last week. There now appears to be a consensus that the Fed will start slowing the pace of interest rate increases. This took a 0.75% increase off the table for the next Fed move, with 0.50% now being the consensus as “a substantial majority of participants judged that a slowing in the pace of increase would soon be appropriate.”
The Fed is increasingly focused on the terminal rate to slow down economic growth as the Fed now believes that “a period of below-trend real GDP growth would be helpful” to help correct the imbalance between supply and demand.
“Various participants noted that, with inflation showing little sign thus far of abating, and with supply and demand imbalances in the economy persisting, their assessment of the ultimate level of the federal funds rate that would be necessary to achieve the Committee’s goals was somewhat higher than they had previously expected.”
One can see how the peak rate for the Federal Funds Rate has been grinding higher after shooting up between August and October. The market is now pricing in a peak rate slightly north of 5%.

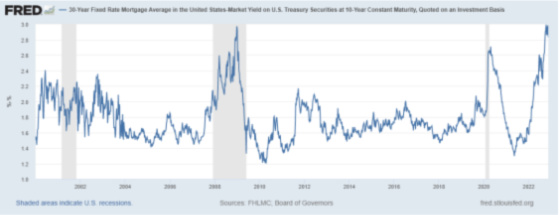
10-year Treasury yields increased significantly, with the terminal rate spiking higher. Since peaking intraday on November 7th at approximately 4.22%, the bond market has been pricing in a less hawkish Fed, with rates dropping by slightly more than 0.50%.

And while mortgage rates have come down with the drop in 10-year Treasury yields, the premium mortgage investors require to own these instruments is still at extremely high levels. As I have mentioned before, the premium now exceeds that of the subprime debacle despite credit quality being much stronger than it was then. The market is requiring a premium for different reasons this time as the Fed is no longer purchasing mortgage-backed securities and may be a seller of them in the future. Mortgage investors have to hedge against a large buyer that is now out of the market (The Fed) and who may also become a large seller.
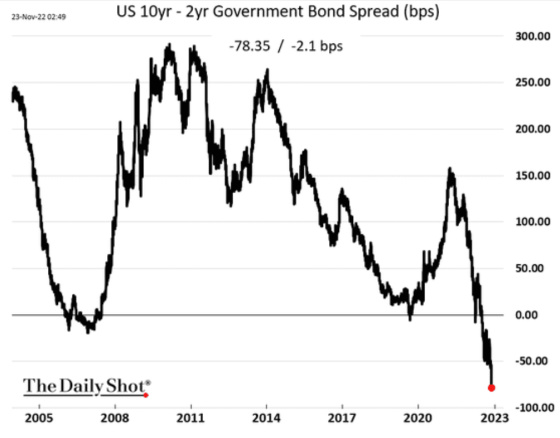
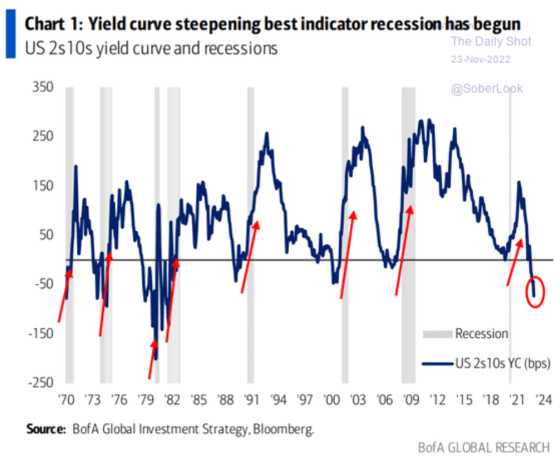
This chart shows how inverted the yield curve (short rates higher than long rates) has been, almost always a precursor to a recession.
Here is a longer-term chart of the yield differential between 10s and 2s. The shaded columns are from when the economy was in a recession.
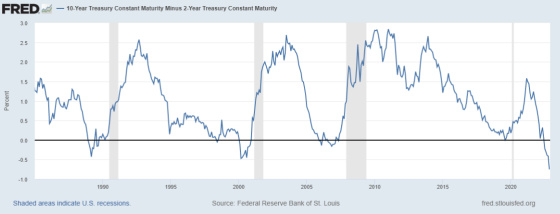
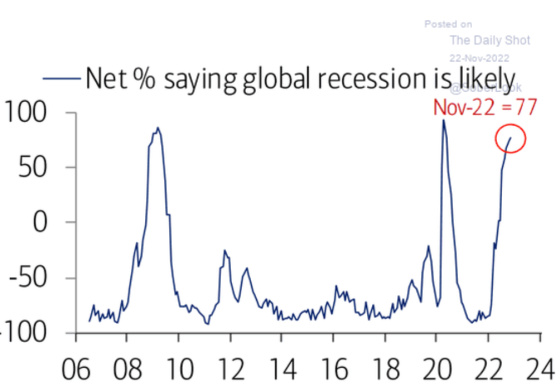
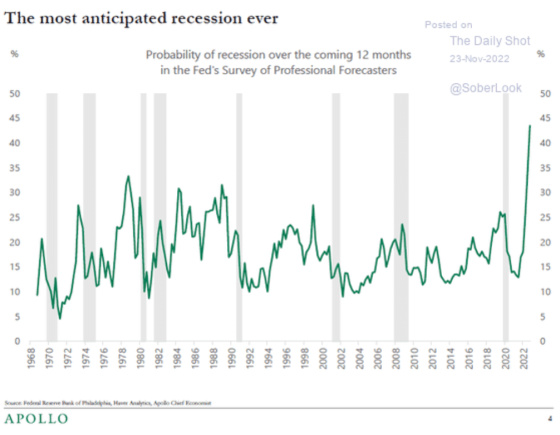
One can see on a longer-term basis that this is the most predicted recession among professional forecasters in the survey’s 54-year history.
I have written about this before, but recessions don’t ensue when the yield curve is inverted but after it has steepened and the inversion has reversed.
What this means is that when the Fed starts cutting rates, the economy is not out of the woods. In fact, it’s going into the woods and will continue to get worse even after it keeps cutting rates.
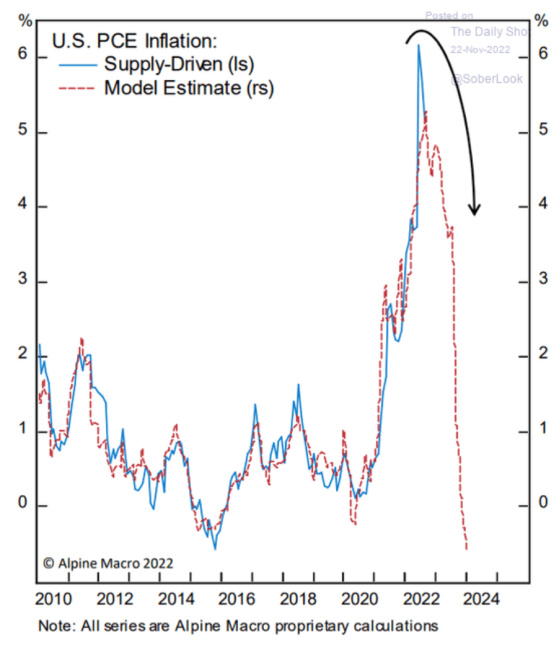
As I have written about ad nauseam, I believe the Fed is looking in the rearview mirror and is raising rates despite so many contrary inflationary signals. One of its favorite inflation indicators is the Core Personal Consumption Expenditure index which excludes food and energy. If this forecast has any validity, then it should be falling off of a cliff as supply chain issues have started to be resolved.
I recently wrote about how important housing costs are, particularly rents, in terms of how it’s driving inflation, even though real-time data suggest rent growth is subsiding. Here is Realtor.com’s estimate of rents. The rate of growth has definitely peaked.

This is an estimate of how core CPI would have been had the index used more real-time rent indicators based on new leases being signed versus the average of leases in place. The gray line shows how behind the curve the Fed was in removing monetary stimulus and now how it’s making the same mistake, but in reverse, by overtightening.

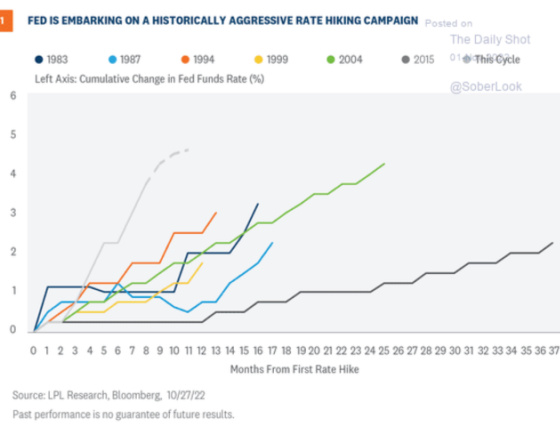
One can see that this Fed tightening cycle is one of the most aggressive in history.
At last, it seems that the Fed is now finally prepared to declare that it is in the later innings of its war on inflation and that while it continues to talk tough, it can no longer ignore that inflation trends and supply chain disruptions have turned the corner and that the data should be a lot more supportive of reaching its 2% target over the next year. The peak in rates is now much more visible. The question is, how long will it stay there?
I continue to believe that how long rates stay at the 4.50% to 5.00% level will be a function of when the labor market starts to crack. There has been a big discrepancy between the non-farm payroll survey and the household survey used to determine the unemployment rate. The latter has been showing a much more subdued job market than the former. I have read about slowing state tax receipts, which is often a good indicator of the labor market’s health and is more in line with the household survey. Only time will tell, however. I’m not going to cherry-pick data to suit my desired outcome.
Shifting Fed – From a CWS Standpoint
From a CWS standpoint, our budgets assume that Libor and SOFR will be averaging slightly more than 5% for 2023. This will result in a number of our interest rate caps being in the money. Nevertheless, it will still be quite painful to our cash flows. Our variable rate loans served as a great hedge during Covid when the economy cratered and rates were reduced to close to 0%. Fortunately, our revenues, while initially under pressure, held up well such that our cash flows increased quite substantially. And when the Fed held off on raising rates during a time when our revenues were growing at unprecedented rates, our cash flow grew even more. And now, with the Fed behind the curve and raising rates quite aggressively, our interest costs are growing much faster than our revenues, which are still increasing, but now at a decelerating rate.
It would be naive to think that our revenue growth won’t continue to weaken in the face of a softening and most probably contracting economy in 2023. Hopefully, the Fed will be more on the ball and adjust rates downward more concurrent with economic weakness. If this is the case then this would filter through to our interest costs and once again serve as an effective hedge against slowing or declining revenues. In fact, not only does the market see lower rates in the years ahead but so does the Fed as represented by the circles, which are the median forecast of the individual members’ projection of future short-term rates. This corroborates the Fed’s view that the neutral rate, the rate that neither inhibits economic growth nor increases inflation beyond its 2% target rate, is 2.50%.
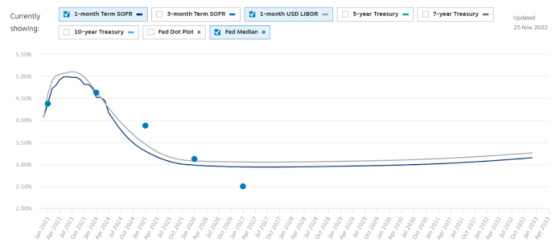
Source: Chatham Financial
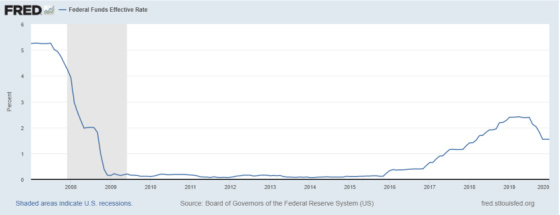
However, if pre-Covid history is any guide, then even 2.50% may be too high as the Federal Funds rate averaged approximately 1% between 2007 and 2019. This is predicated on the belief that we will return to a slower growth environment in which disinflation is the bigger risk versus an environment driven by aggressive fiscal and monetary stimulus that keeps inflation as the primary economic risk.
Only time will tell.
Have we experienced “disinflation” before? Great Depression? Is disinflation as it sounds, a reversal in prices?