
I greatly enjoyed watching the Wimbledon finals between Novak Djokovic and Nick Kyrgios. Novak has won numerous Wimbledon championships, while Nick has never been in the final of a major despite having enormous talent. Djokovic is incredibly disciplined, committed, consistent, and has amazing mental fortitude and problem-solving skills. Kyrgios, on the other hand, is very different.
He trains inconsistently, and he doesn’t work nearly as hard; he can be demonstrative on the court, but that takes away from his focus and effectiveness, he doubts whether he should even be playing at such a high level, and he just doesn’t have the hunger of the top players. And yet, with all of that, he is very fun to watch, and one can see that he has immense talent, especially when it’s in conjunction with one of the best serves in the game. Watching Nick is like being on a wild ride that you never know where it will take you. It’s far more entertaining than watching the unflappable Novak.
Novak and Nick Economy
If you want to see the differences between the mindset of a champion and one who has incredible talent but is far from a champion’s level, then I suggest you watch the two press conferences after the finals. They are instructive enough that I think they’re worthy of a blog dedicated to analyzing the two.
And, yet, I’m not focusing this week’s post on Novak and Nick. Why not? The usual reasons are inflation, the Fed, and interest rates.
Novak-Type Economy
For many decades we have had a Novak-type economy. Fairly predictable growth, consistent forces influencing the economy leading to declining inflation over a long period of time, and a correspondingly more gradualist Fed that has had a bias to keeping interest rates low. With the advent of Covid and the resulting dislocations this brought about, however, we have been in a Nick economy. It’s been much more volatile and unpredictable, with tremendous ups and downs in terms of economic output, the job market, fiscal policy, political and social divide, and Fed policy that pivoted from Novak to Nick.
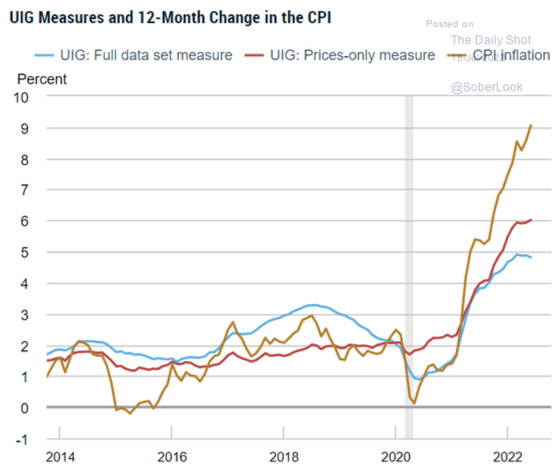
This chart is a decent reflection of the shift from Novak to Nick. One can see how CPI was consistently undershooting the Fed’s 2% target. This led the Fed to adopt a longer-term 2% average target which meant that it was ok if inflation breached 2% in order to make up for the years in which it was less than 2%. This would allow investors to price in a more accommodative Fed that wouldn’t cut off economic growth through higher rates and tighter monetary policy the moment that inflation exceeded 2%. But that was all predicated on the Novak economy. And then Covid brought about the Nick economy.

The Fed was operating under the belief that we were still in a Novak economy when it asserted that inflation was transitory and that there was no need to deviate from its monetary path of remaining accommodative for a certain period of time. It was letting its previously announced deadlines rule its decision-making versus the facts on the ground. Unfortunately, it was late to determine that we were now in a Nick economy. And now the Fed is reacting a lot like Nick on the court. Fed members are scared, mercurial, angry, emotional, reactive, and thinking very short-term. They are no longer deliberate, disciplined, consistent, calm, and long-term oriented like Novak. And this is going to cause more pain than is necessary and hasten the return to the Novak economy as one can see that recession risks are rising materially.

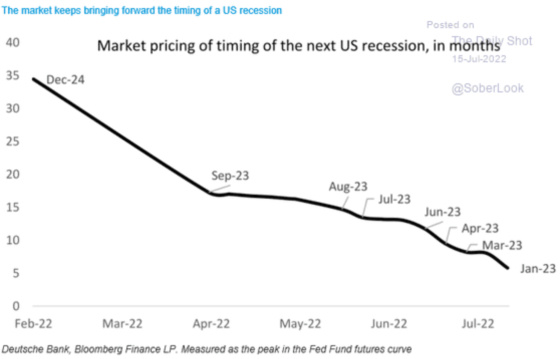
As the Fed has transitioned more and more from Novak to Nick, the market has been pushing forward the timing of a recession.
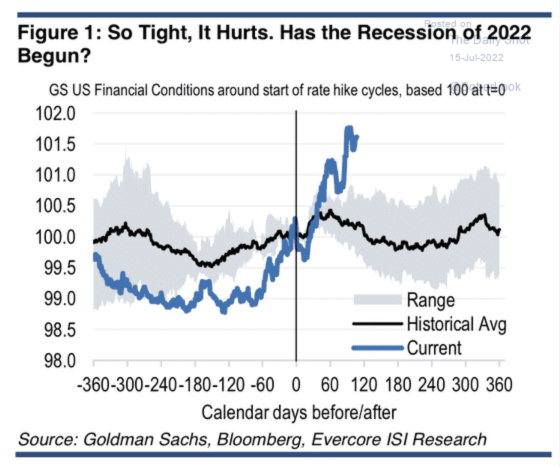
As a result, financial conditions have become quite tight at this stage of the Fed tightening cycle; although they were admittedly quite loose beforehand, some of this is making up for that.
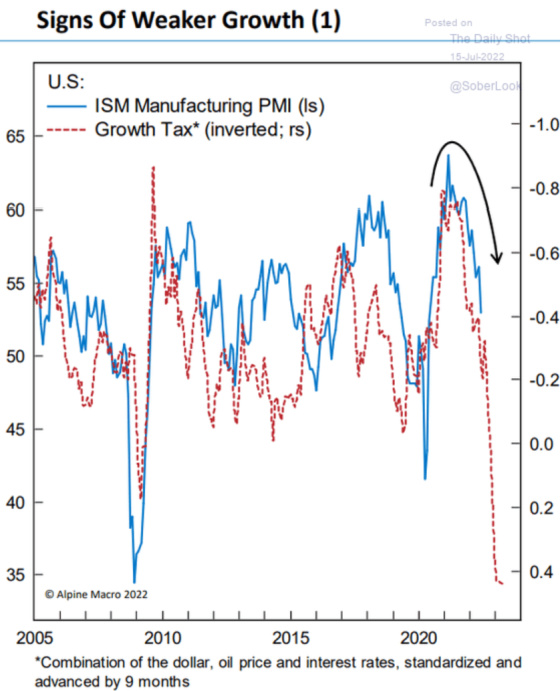
And when combining higher interest rates, oil prices, and the incredibly strong dollar, these are all conspiring to make the outlook for manufacturing extraordinarily weak.
Nick-Like Fed
As this chart shows, the weakening economic outlook and an unhinged Nick-like Fed have made it clear to investors that inflation is now transitory.
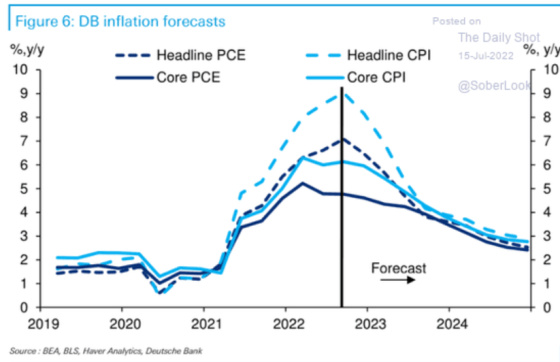
Don’t take my word for it, or Deutsche Bank’s take the bond markets.
Last week was seminal in terms of markets definitively pricing in peak inflation, peak rates, and subsequent Fed cuts. First, a few inflation indicators show how high these readings have gotten. These are great depictions of the transition from Novak to Nick.


This chart is a Fed indicator that tracks different ways of measuring inflation through its Underlying Inflation Gauge. Another example of going from Novak to Nick.
The two-year Treasury yield is very sensitive to Fed policy direction given its relatively short maturity. After last week’s higher-than-projected CPI and PPI reports, the yield shot up by nearly 20 basis points, especially after one of the Fed committee members said everything was on the table in terms of rate hikes. This led the market to start pricing in a high probability that the Fed could raise rates by 1% on July 27th after the conclusion of their two days of meetings.

And yet, the two-year yield ended up pretty much unchanged for the week. What about the 10-year yield, which is less sensitive to Fed policy and more impacted by long-term growth rates and inflation expectations?
It came down about 20 basis points for the week in spite of the terrible inflation readings.

I have written ad nauseam about inverted yield curves and how they are harbingers of slowing economic growth and recessions. Last week this happened, which is not a good sign for economic growth.
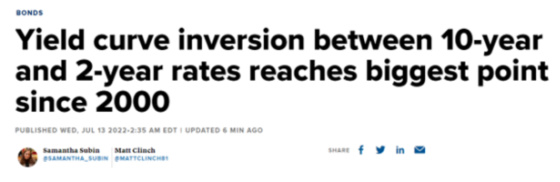
The bond market is clearly signaling that the Fed is going to overtighten and will induce a recession or a very meaningful slowdown in the economy.
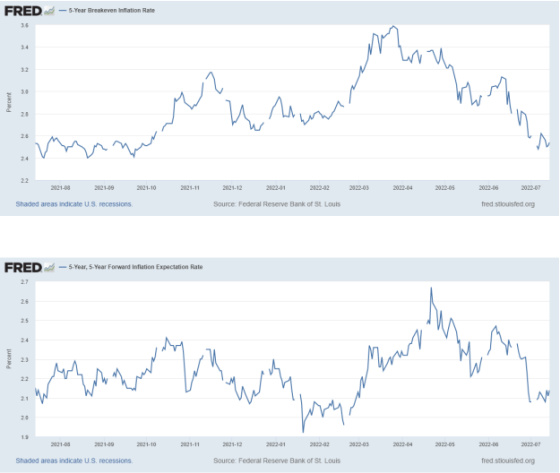
The Fed is concerned about elevated inflation expectations becoming entrenched in the economy, but this concern seems to be dissipating if these next two charts are any indication.
All of this has come together to reflect a Fed that will remain extraordinarily aggressive through 2022 to put the kibosh on the Nick economy in order to bring back the consistency, steadiness, and predictability of the Novak economy. The following chart shows the forward curve for 30-day LIBOR and Term SOFR, which are important private sector borrowing indices. One can see that the Fed will hit Nick hard only to take its foot off the brake after it has done enough economic hardship to wring the excesses out of the system and start cutting rates in 2023 and beyond.

If we truly get back to the Novak economy, then I think rates will go back below 1.50% on the short end. I think enough damage will be done to the economy and financial markets, combined with the long-term disinflationary forces still being present (aging populations, technological innovation, financialized, indebted economies, globalization (more questionable)), that I would bet on rates being closer to 1.50% than 2.50% from 2024 on.
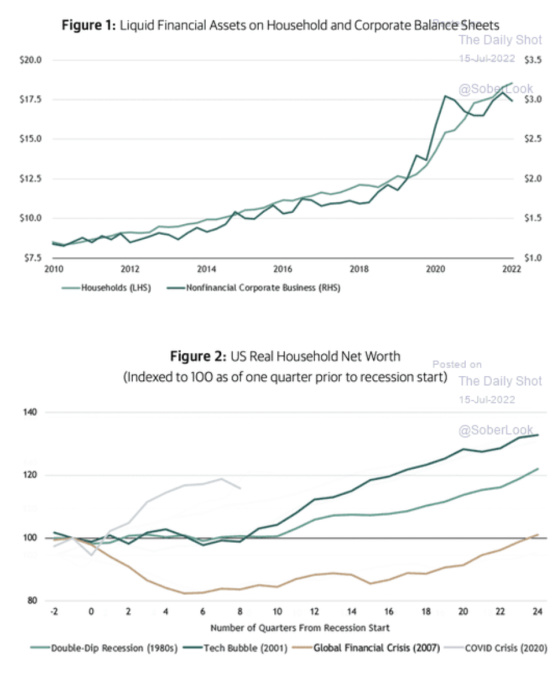
All is not doom and gloom, however, as U.S. households are going into this potential downturn in much healthier shape financially, so I would expect a recession to be much milder than what we experienced during the Great Financial Crisis.
And while the Nick economy has been on a wild ride and at times very entertaining and profitable for those investors positioned appropriately, it’s also caused a lot of pain and whipsawing of investors, businesses, and everyday Americans. It has required investors to remain very nimble and on their toes because it has dramatically changed the Fed’s reaction function to Nick from Novak. And yet, this dramatic flip-flopping is now setting the stage to returning to more of a Novak economy and lower interest rates (after continuing to go higher the rest of this year) in 2023 and beyond.
Leave a Reply