Yeah, now the workforce is disgusted, downs tools, walks
Innocence is injured, experience just talks
Everyone seeks damages, everyone agrees that
These are classic symptoms of a monetary squeeze
On ITV and BBC they talk about the curse
Philosophy is useless, theology is worse
History boils over, there’s an economics freeze
Sociologists invent words that mean “industrial disease”
-Industrial Disease by Dire Straits
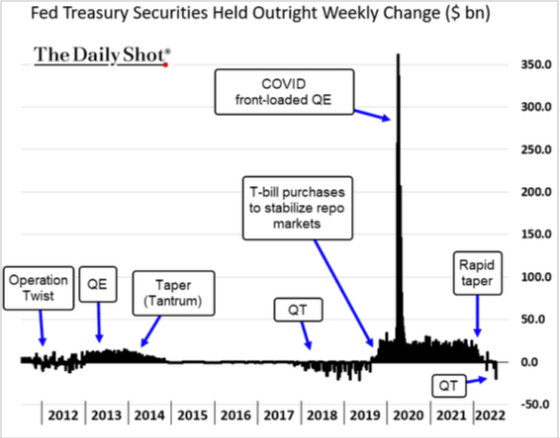
The Federal Reserve is finally embarking upon its quantitative tightening program. It is now beginning to shrink its balance sheet by no longer reinvesting maturing Treasury securities and mortgage-backed securities. It has not ruled out selling securities as well. This has already had and will continue to have, powerful implications for financial markets, industrial output, housing, and the overall economy.
The monetary squeeze is at risk of triggering industrial (and housing) disease.
The incredible tailwinds for the economy and investors related to huge government spending and a very accommodating Fed are now becoming headwinds. This chart is an indicator of how loose or tight financial conditions are and its impact on future S&P earnings. One can see that the outlook is not pretty for corporate earnings.

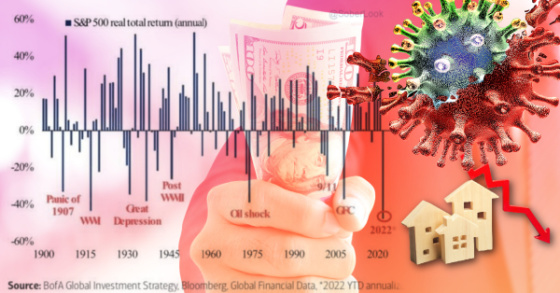
The changing monetary landscape and prospect for weak corporate earnings have resulted in one of the worst-performing stock markets, when adjusting for inflation, in history.
This downturn is comparable to other very painful economic times such as the Great Depression, post-war downturns, 9/11, and the Great Financial Crisis. Click To Tweet
This table shows the worst six-month stretches for the stock market (Wilshire 5000 not adjusted for inflation). The first six months of 2022 are the 11th worst. Do note, however, how impressive longer-term returns are (with a few exceptions) so buying in after deep corrections and having a long-term horizon can be very rewarding for investors.

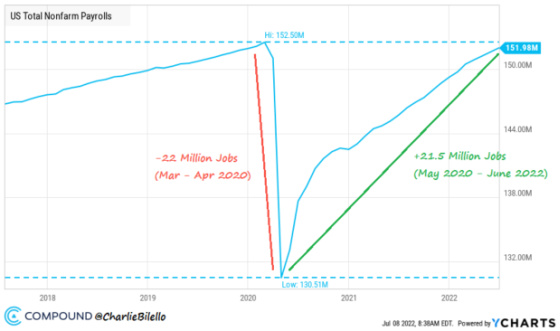
The poor 2022 stock market performance has taken place in spite of a job market that has recovered nearly all of the jobs lost from Covid.
And despite stocks performing very poorly, bonds have had a terrible 2022 as well. What’s fascinating about this next chart is how high the ratio of a stock index is to a bond index and how this very high ratio has been a leading recession indicator. I’m not sure why the 2020 top wasn’t flagged as well as it too was a leading recession indicator.

And here is another chart that is heading into recession-predicting territory. When inventories for manufacturers exceed new orders companies inevitably have to curtail production and cut back on labor to get back into balance.

And with the release last week of the minutes of the latest Federal Reserve meeting, combined with a stronger-than-expected jobs report, the market perceives that the Fed will remain very hawkish. In spite of many financial and economic indicators showing that economic growth is slowing significantly or even contracting, the Fed is going to raise rates aggressively come hell or high water.
Contrast the GDP Now projection of next quarter’s GDP report from the Atlanta Fed with the renewed increase in 10-year Treasury yields.


I cited lyrics at the beginning from Dire Straits’ Industrial Disease. I’ll tap into that great song one more time to shine a light on the seeming contradiction between what appears to be slowing economic growth, or even contraction, and a hawkish Fed and higher rates.
Now, I go down to Speaker’s Corner, I’m thunderstruck
They got free speech tourists, police in trucks
Two men say they’re Jesus, one of them must be wrong
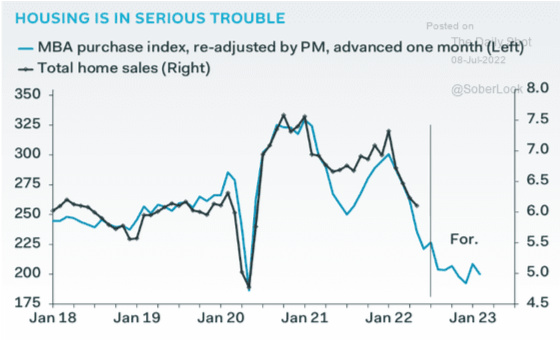
Let me finish this post off with a chart frenzy related to housing and its rapidly diminishing prospects related to much higher mortgage rates meeting very high home prices.
The ratio of home values to median incomes has now exceeded the bubble peak in 2006-7.

Fortunately, loan underwriting has been much better in this cycle than in the early to mid-2000s which has resulted in a record low in delinquency rates. This ratio is also helped by homeowners having a lot of home equity that they have a big incentive to protect by keeping their payments current.

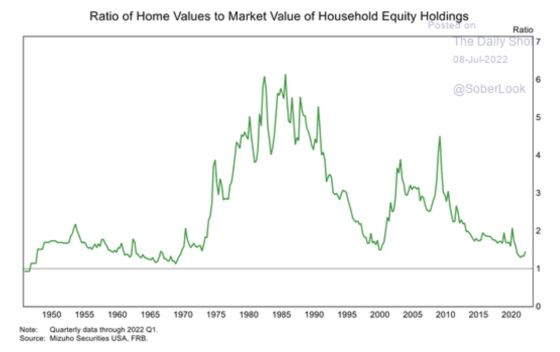
Households are not as concentrated financially in housing relative to equities holdings which suggests that a housing downturn may not be as painful as it was in the mid-2000s.
And while I feel like we’re going into a housing downturn, or significant slowdown, in much better shape than in 2005-7, the significant increase in mortgage rates is a leading indicator that suggests clouds are on the horizon.

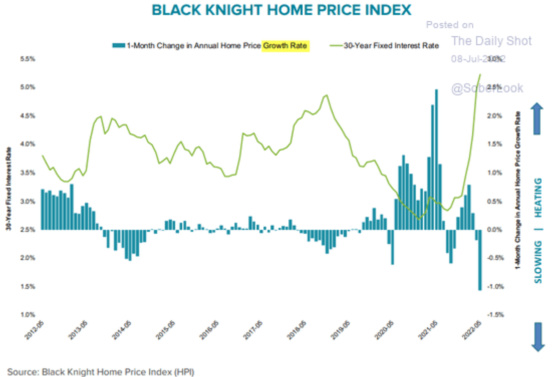
The outlook for home price appreciation is deteriorating rapidly.

One can see how home prices escalated significantly and persistently as mortgage rates dropped. Now, this is reversing with rates much higher and appreciation turning into price reductions.
We are now starting to see price drops at the highest level since 2015 when this data started being tracked by Redfin.

Cancellation rates have skyrocketed as many new home purchasers have either had their rate locks expire or did not expect rates to rise as they have. This has resulted in a monthly payment much higher than what they had planned on and has led many people to cancel their agreements.

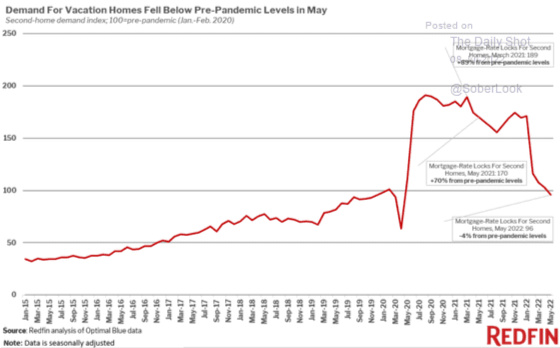
The demand for vacation homes has been dropping quite significantly as well which will put added pressure on housing statistics by lowering demand. Vacation homes are notoriously volatile as people often realize that they don’t use their homes enough to justify the cost. It was one thing to jump in during Covid to find a haven to live and work and benefit from the appreciation. It’s another, however, when one has experienced owning a destination home with Covid now being more integrated into our daily lives, and now maybe questioning whether the benefits outweigh the costs. Vacation home sellers are less price-sensitive when trying to sell their homes because many want to be relieved of the burden of owning a second home. I would expect this market to soften much more than primary residences.
Finally, we are seeing a precipitous drop in the homebuilder sales survey. It has decelerated at a 45-degree angle since April and looks to continue lower as mortgage rates remain quite high and consumer sentiment skittish.

The Fed is clearly putting a monetary squeeze on the economy and this is being reflected in a brutal stock market, a vicious bear market in bonds, financial conditions tightening, commodity prices well off of their highs, and the outlook for owner-occupied housing turning negative with the rapid run-up in mortgage rates. And with Covid demand decelerating for goods and shifting more to services and experiences, I’m afraid we could be faced with industrial (and housing) disease exacerbated by a monetary squeeze.
Leave a Reply