
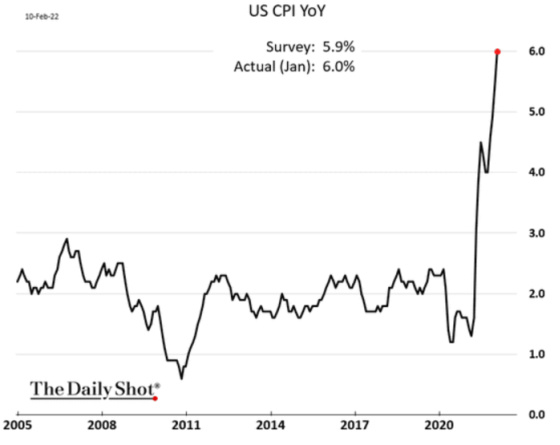
Last week’s CPI report sent shockwaves through bond markets. It came in extremely hot.
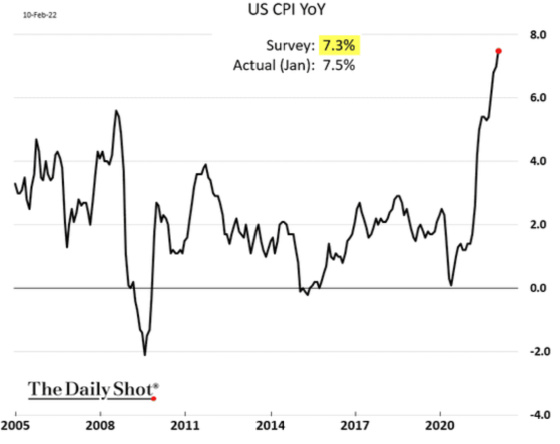
Other inflation indicators are running very hot as well.

Interest rates have gone up incredibly fast as investors fear a very hawkish Federal Reserve.

Thursday’s move was the most significant increase in 2-year rates in 12 years.
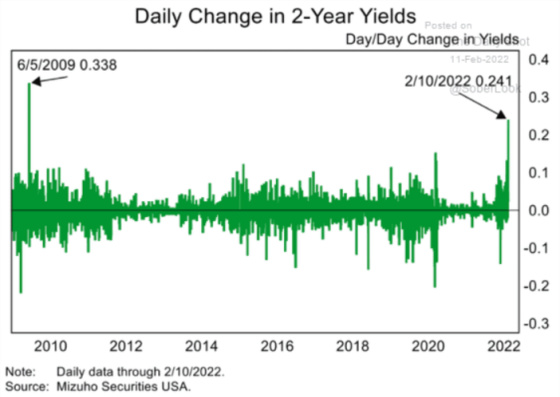
From a more wonky, nerdy statistical perspective, it was the largest move since 1979.

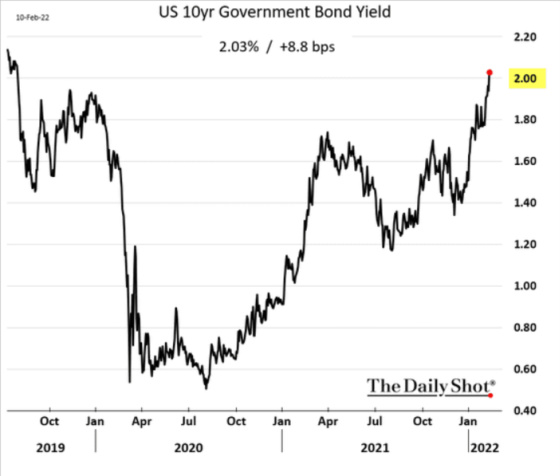
10-year Treasury yields breached 2.00% for the first time since 2019.
But here’s the rub. The market seems to be pricing in the Fed becoming too hawkish and triggering a slowdown or a recession. The difference between long rates and short rates is compressing significantly, indicating that investors are pricing in slower growth ahead.

In fact, the Atlanta Fed’s GDP tracker is showing growth slowing much more significantly than professional forecasters.

Here is a very interesting chart. This shows how investors are pricing in an inverted yield curve (short rates exceeding long rates) within a year, which almost always foreshadows a recession.

The market is pricing in seven interest rate hikes in 2022 based on the following path.

Boomcession
In my opinion, I think we are in a boomcession. Yes, right now things are going strong and CPI is running very hot, but this is due to dislocations from Covid and the supply chain mess that is causing the system to get backed up, prices to rise, costs going up for consumers, and real wages dropping. Inflation is without question hurting the Democrats and their mid-term chances so I don’t think there will be political will to pass any meaningful spending programs other than the infrastructure plan because Senator Manchin equates government spending with adding to inflation so there is no way he will be swayed in what is an election year for him running in a conservative state.

This will result in a large fiscal contraction and I don’t see how the Fed aggressively raising rates will open up the supply chain unless they want to curtail demand. Demand is already going to be at risk and raising rates aggressively will only exacerbate this risk.
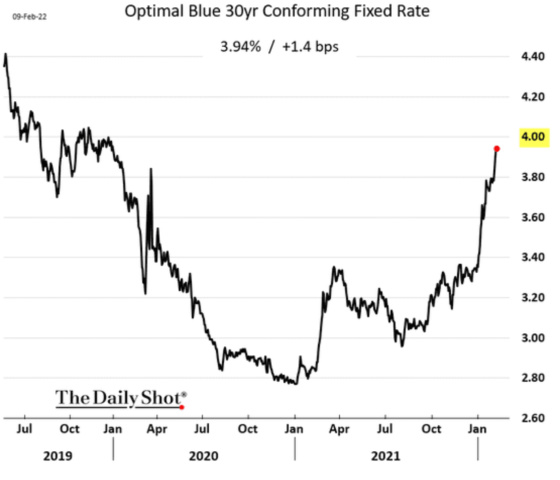
As mentioned above, the market is pricing in a Fed policy mistake, and GDP is projected to slow. The housing market will be impacted by higher mortgage rates, which have gone up sharply in a short period of time.
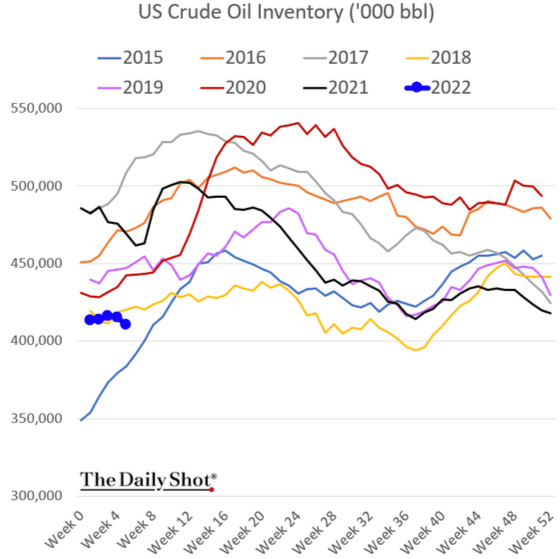
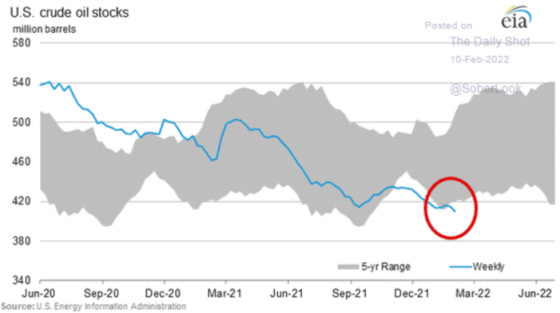
There is more demand for energy than supply which will act as a tax for consumers. The following charts show how low inventory levels are for crude oil and all liquids.


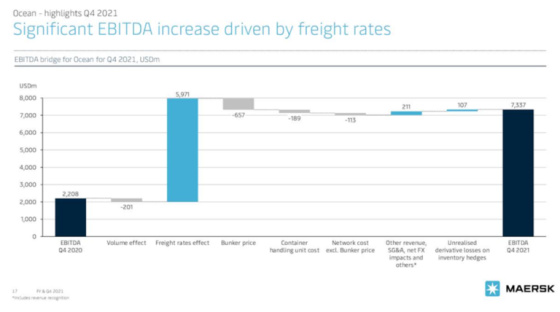
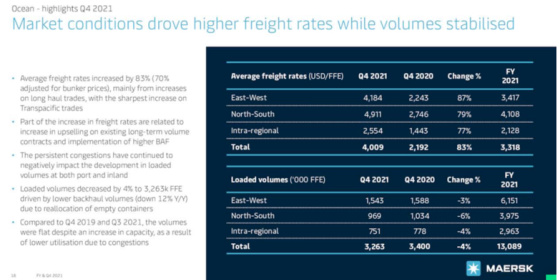
This next table and the comments to the left are very informative. It shows how average freight rates went up 83% while volume dropped 4%.
The comments suggest that port congestion and logistical challenges curtailed volume. There must be something to that because prices would not have gone up like they did unless demand was far greater than supply. It is interesting to note, however, that the last bullet point says that Q3 2021 volumes were flat compared to Q4 2019 in spite of an increase in capacity during this time.
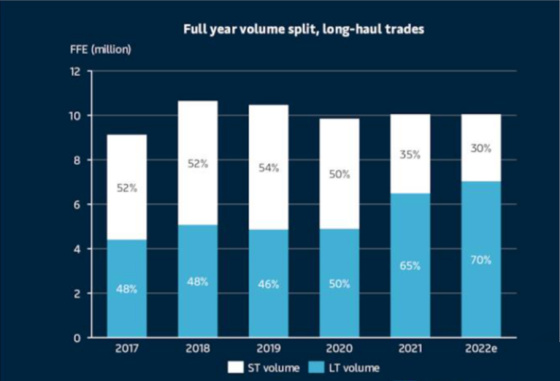
Here’s a little longer-term perspective to show shipping volumes prior to Covid and any supply chain issues, along with the projection for 2022. This chart shows long-haul volume split between short and long-term contracts. One can see that there has been no growth since 2020 and a contraction since 2018. This doesn’t seem to me like a booming world economy, even though the demand for goods has gone up as a share of spending relative to services.
I’m going to make out-of-consensus speculation here.
I think a lot of the excess demand came from over-ordering by customers to do whatever they could to procure inventory for the holiday season. I think that the Fed is in panic mode and they are going to tighten into a slowing economy. They have political cover to act because inflation is now a very big political liability for the Democrats. And yet, if the Fed’s supposed omnipotence with loose monetary policy and low unemployment couldn’t get core inflation much above 2% as the following chart shows…
…then maybe there are structural forces at work, or they don’t have the power they think, to control inflation. Of course, they can tighten until the financial system starts to crack, loans start going sour, risk appetites turn to risk aversion, lending gets curtailed, employment is cut back, and spending contracts such that we have a very painful demand crushing recession.
The one thing this inflationary outbreak has that we haven’t had in the last 20+ years is a huge fiscal injection into the economy. It’s pretty much that simple. That stimulus pulled forward the demand for goods and services and housing which ended up creating tremendous distortions along with massively shifting consumer preferences, location choices, and lifestyle and working (or not working) decisions. The stimulus has ended, mortgage rates are higher, energy prices are starting to bite (I pay $5.00 per gallon for gas in California) and seem poised to stay elevated absent a big contraction in demand, consumer confidence is impacted by lower real wages, retailers have potentially overstocked, and now the Fed is on an aggressive tightening path. To me, this smacks of a slowdown in the making. And when this is combined with the tremendous amount of debt that’s outstanding as the following chart shows…

…we have the prospect for great instability ahead if the Fed becomes too aggressive.
I think these next two charts sum up what I’m trying to convey. Historically small-cap stocks do well when the economy is strengthening and growth is accelerating. This usually correlates with higher long-term interest rates. This chart, however, shows a disconnect between higher rates and the performance of small-cap stocks which suggests that equity investors don’t see growth ahead, but a slowdown.

The story is similar to a basket of stocks that make up the Economic Prediction Index.

From a CWS perspective:
It now looks very possible that our budgeted average for 30-day Libor being 75 basis points in 2022 may be ok for the year but significantly off starting in May. We will have benefited from Libor having been at approximately 11 basis points for the first three months of the year but then the gap will start closing quite rapidly beginning in May. With that being said, even with Libor in the 1.75% range, our average interest rate would be approximately 3.50% for our variable rate loans which make up over 80% of our portfolio. This is still a good rate and doesn’t even take into consideration all of the benefits we gained from having rates at less than 2% over the last year.
Thus, if Libor stays at 1.75% or so for three years, then our average rate over that four-year period will have been approximately 3.09%, which is still a good rate while still providing great prepayment flexibility.
In addition, since I think we’re heading into a slowdown then we can also benefit from the Fed not being able to hold rates at that level for very long as it will be forced to either cut rates from there or maybe not even be able to get to that level.
I still like the cards we’re holding.
Leave a Reply