
Although I’m in the camp that the Fed will stick to its word and not raise short-term interest rates until after 2023 at the earliest, the market is betting differently. Rather than focusing on when the Fed will start raising rates, let’s assume that they will. With CWS’s property debt being approximately 83% variable rate loans, we will naturally be impacted by this. Right now we are benefiting from this exposure as our weighted average interest rate is approximately 1.80% which is approximately 2% less than the fixed rates that were available to us when our loans were originated. It’s also about 1.70% less than today’s fixed-rate loans.
When the Fed starts raising rates our benefits will compress but by how much?
The questions that must be answered are how high will short-term rates go and what will they average over the next cycle.
A note of caution. This may end up being a bit confusing for those readers who choose to dive into this. I’m admittedly trying to find historical relationships and some guideposts that can help me peg where I think Libor might peak during this cycle. I often use my blog to work through issues I’m wrestling with to help me gain some clarity. One might argue that after reading this that I am less clear than when I started. It’s definitely a work in progress and should be more appropriately viewed as a scratch pad than a very well-thought-out and cogent analysis. I think where most of the roads are leading me right now is that Libor will peak at a rate that should be manageable financially and that its average over the next cycle should still be low enough to generate a lower average interest rate for the properties in the CWS portfolio financed with variable rate debt as compared to the fixed-rate alternative. This shouldn’t be a very surprising outcome because it’s been quite consistent with the results over the last 35 years.
Before sharing my back of the envelope approach, here is the forward curve for the 30-day Libor from Chatham Financial.
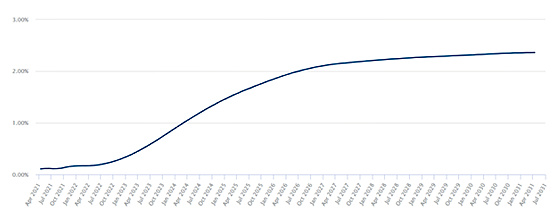
The market has Libor hitting a peak of 2.36% over the next 10 years and averaging 1.54% during this time frame. I won’t necessarily quibble with the peak but I would expect the average to be lower. The forward curve typically has that kind of shape whereby it’s gradually rising and flattening out in the future at its peak. This is rarely the case as you will see from this chart of 30-day Libor from inception in 1986.

What can we infer from this chart? First, it does not follow the path of the forward curve. Second, and more importantly, each cycle has produced lower highs and lower lows. This is starting to change somewhat with the last two cyclical lows as we have come close to 0% for each and, assuming the Fed does not bring rates negative, we can’t really go materially lower. The cyclical peaks have been approximately 10%, 7%, 6%, and 2.5%. Assuming that this trend of lower highs holds, then one would expect the next cyclical peak to be less than 2.50%. But how much lower?
One way of trying to peg the upper bound of Libor during this cycle is to look at the relationship between the 10-year Treasury note yield and 30-day Libor.
The following chart shows the spread between the two since 1986.
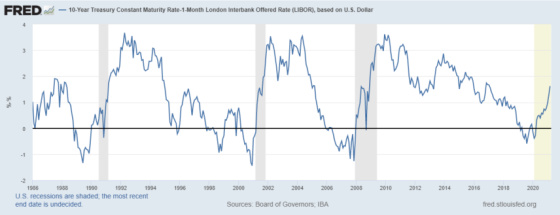
One can see that it has ranged between around -1% (inverted yield curve foreshadowing a recession) and 3.5% (steep yield curve forecasting strong economic growth). Currently, the spread is starting to increase from being slightly inverted, suggesting that the market is expecting economic growth to resume beyond just the Covid snapback. This is entirely due to the increase in the 10-year Treasury yield as can be seen by this chart.

After bottoming at approximately 0.55%, the 10-year has risen to approximately 1.65% while the 30-day Libor has hardly moved.

Since 1986 the average spread between the 10-year Treasury note yield and 30-day Libor has been approximately 1.31%. If you thought that the 10-year would stay at this level then this would suggest that 30-day Libor would settle out at approximately 0.35% based on the long-term historical average. It is interesting to note that during the last two cycles (Sept. 2007-April 2010 and April 2010-August 2019) they have averaged 1.79% and 1.70% respectively. The first was an interest rate decreasing cycle for short-term rates while the second was generally the opposite. Given how badly the labor market and economy were hit by Covid, I would not be surprised if the Fed keeps a steeper yield curve than the historical average of 1.31% during this cycle.
This would result in the 10-year Treasury potentially going higher without Libor moving up much.
If, on the other hand, we have strong economic growth and this causes the Fed to raise interest rates such that it leads to an inverted yield curve then this would have Libor peak at approximately 2.65%, which is 1% greater than today’s approximate 10-year yield. I don’t see this happening in that I don’t expect it to exceed the previous cycle high or 2.51%.
In addition, one can see from this chart that the 10-year also displays a pattern of lower highs and lower lows. In the last few cycles, it’s been dropping by about 1% from the previous peak. With the last peak at approximately 3% this would suggest that the peak for this cycle could be in the 2% range if it follows a similar pattern.

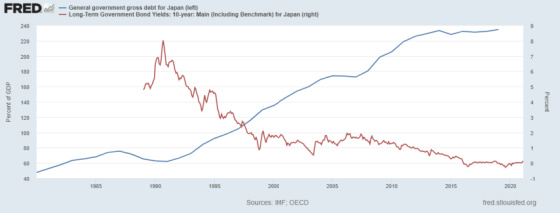
I just don’t see a 3% Libor with a 2% 10-year yield. I would expect the 10-year yield to start dropping as bond investors sense an economic peak on the horizon. My guess is that Libor will not go past 2.25% in this cycle. One reason for believing this is that I have thought for a long time we have been following the trajectory of Japan. We too are aging, although not nearly as rapidly as Japan, and our rates have been consistently falling in spite of increasing amounts of government debt. This is a graph showing Japan’s public debt as a percentage of GDP and its 10-year government bond yield. As the debt has grown, long-term rates have dropped.
The following chart shows how Japan’s yield curve has stayed positive almost the entire time during its very low-interest-rate environment since 1995.

If this almost constant positive yield curve takes place in the United States then this would result in Libor being lower than the 10-year yield, even during times of economic stress with only the occasional, temporary inversion. Here is the chart showing Japanese 10-year yields versus its 30-day Libor since 2016. One can see how rare inversions have been during this very low rate environment.

Since our long-term rates are still quite a bit higher than Japan’s I thought I would find a time when they were in the range of where we are today. Between 1999 and 2008 the Japanese 10-year yield averaged 1.48% while its 30-day Libor was 0.24%. This spread of 1.24% is not too different from the long-term U.S. average of 1.31%. As I mentioned previously, the last two cycles have produced a spread that is more in the 1.75% range as the Fed has had a bias to keep rates lower relative to the 10-year than its historical average. This has been very beneficial for variable-rate borrowers like CWS because our cost of funds benefits from the low short-term rates while fixed-rate borrowers pay the higher cost of the longer-term rates.
If this wider spread holds and 10-year yields stay in the 1.65% range then Libor would be close to 0%, which is in the range of where it is today. If we use the minimum spread for Japan between 1999 and 2008 this was 0.32%. This would imply a Libor of 1.33% based on today’s 10-year and 1.68% if you think the 10-year peaks at 2%. If the 10-year peaks at 2.50% then this would move Libor to 2.18% for the cyclical peak.
This is why I think Libor doesn’t go much beyond 2% at its peak.
The point of all of this is that I still think that having a large variable rate exposure offers a compelling risk-reward trade-off. If Libor averages less than 2% during this cycle, which I think is a very high probability, then we should have a lower cost of funds as compared to the fixed-rate alternatives while preserving much greater prepayment flexibility. My back of the envelope guesstimates tells me that CWS should continue to emphasize variable rate loans.
Hopefully, that wasn’t too confusing.
Leave a Reply