
Under most economic environments longer-term debt instruments yield more than shorter ones. This is the case in order to compensate investors for risks related to purchasing power eroding and more uncertainty and volatility that can increase the probability of default (outside Treasuries). In addition, our banking system is based on banks accessing short-term deposits and being able to make longer-term loans and investments which necessitates longer rates being higher than shorter ones so banks can be profitable.
The following table shows the average spread (in basis points) between various debt instruments or indices since 1986. I chose 1986 as the starting point because that is when LIBOR was introduced.
| 1 Month LIBOR | 3 Month LIBOR | 5 Year Treasury | 10 Year Treasury | |
| 1 Month LIBOR | N/A | 11 | 86 | 139 |
| 3 Month LIBOR | N/A | N/A | 75 | 128 |
| 5 Year Treasury | N/A | N/A | N/A | 53 |
| 10 Year Treasury | N/A | N/A | N/A | N/A |
One can see from the table above that, true to form, the average result since 1986 has been to have longer-dated instruments yield more than shorter ones.
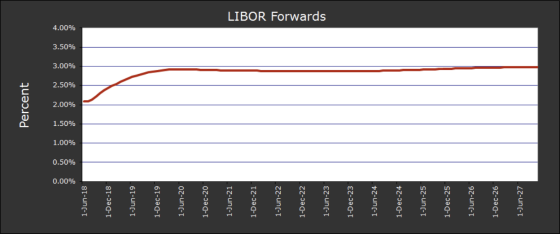
We are customers of Chatham Financial. We use them to facilitate the purchase of our interest rate caps for our variable rate loans as well as some other services. Each week they send me the forward curve which shows what investors are pricing in for future yields among different types of debt instruments. The instruments in the table above are what is included in their weekly forward curve report. So what are the forward curves showing now? It’s shockingly uniform and flat as the following graphs show.
This first chart shows the forward curve for one month LIBOR. It shows Libor hitting about 3% and staying flat through June 2027.
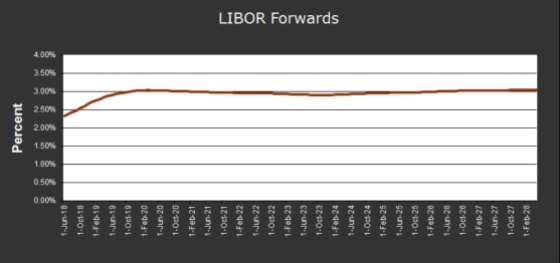
One would expect the 3 Month LIBOR forward rates to be about 11 basis points higher on average. This is not the case as they are about equal to 1 Month LIBOR.
How about the 5-Year Treasury? One would expect this to average about 3.75% or so. Sorry, Charlie. We’re still at 3%.

Surely the 10-Year Treasury forward rates must be in the 4%+ range. Nope. All roads lead to 3%.

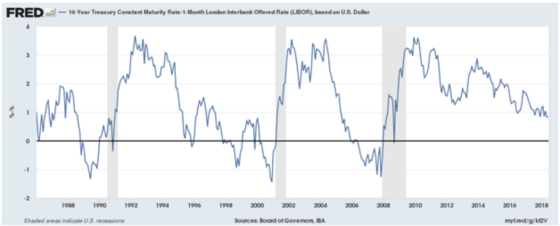
Perhaps I should have entitled this post “The World Is Flat (or at Least the Yield Curve Is and Will Be)” Typically a very flat to inverted yield curve tends to foreshadow sub-par economic growth or potential contraction. Thus, it is very interesting to see that bond market investors are pricing in a flat yield curve for essentially the next 10 years.
This seems to be consistent with my buy-in of the “lower for longer” thesis that, due to demographics, automation, globalization (pre-tariffs), shareholder-friendly capitalism, and global economies highly correlated with debt expansion, rates moving materially higher is just not in the cards.
Over to you:
What are your thoughts?
Gary, good morning. I came upon your blog as a result of perusing CWS website (a client is looking at acquiring one of your marketed properties). I found your blogs very interesting, and will be ordering your book as well. As a mortgage banker, there is clear interest in the floating/fixed rate loan debate, for the shorter duration loans (<5yrs). Recently, clients have been opting for the the fixed (with prepayment flex) due to the relative high cost of the 2-4yr LIBOR caps and certainty of fixed rate. However per your charts above, it would appear that the cost of the caps should be lower in the next 12 months (and beyond), due to the projected flatness of the forward LIBOR curve through 2027. Given this is the case, it would continue to add support to your favoring of LIBOR based deals vs fixed rate (short term), true? Or per charts above, with LIBOR @ 3% and the 10yr @ 3% (guessing the 5yr closer to 2.75%), are you now in the "fixed rate camp"?
Thank you for your kind words and your thoughtful question. We have done some fixed rate loans and negotiated flexible pre-pays for the last three years or so to help buy more flexibility without much additional cost given the flat yield curve. We are also doing another HUD loan. With that being said, our bias is still towards floating rate loans. What I should have ended the blog post with but I was a bit too lazy to do so was to state that I don’t think it’s tenable to have such a flat yield curve for the next 10 years. It would wreak too much havoc on the banking system in my opinion. The more likely scenario I would bet on is the yield curve becoming more “normalized”. If this is the case and the average spread between the 10 year Treasury and 30 day Libor is 139 basis points and if you believe 3% is sort of the base case average rate for the 10-year, then this would imply a 30-day Libor of 1.61%. Then the question becomes spreads over Treasuries and Libor, investor needs, risk tolerance, etc. I still value highly the flexibility of floating rate debt and see it as a bit of a recession hedge as well.
I hope this helps and I hope you enjoy the book as well.