
Hey, don’t you worry, I’ve been lied to
I’ve been here many times before
Girl, don’t you worry, I know where I stand
I don’t need this love, I don’t need your hand
I know I could turn, blink, and you’d be gone
Then I must be prepared any time to carry on
-Minute by Minute (The Doobie Brothers)
Yes, I admit that I’m taking it harder than I should, feeling lied to by Federal Reserve Chairman Jerome Powell who was adamantly on record as saying that the Fed wouldn’t raise rates until the end of 2023 at the earliest. Well, like the jilted lover in the lyrics cited above, I know where I stand. I guess I always did but didn’t really want to admit it. Heck, I’m the one who always cites John Maynard Keynes who supposedly said “When the facts change, I change my mind.” So why should I be surprised or upset that Powell is pivoting the Fed from being very loose and accommodating to more hawkish now that they are concerned that inflation is no longer transitory? Let’s turn to the highlights from the Fed minutes that were released last week and caused so much consternation.
John Maynard Keynes who supposedly said “When the facts change, I change my mind.”Click To TweetThe FOMC minutes revealed an even more hawkish Federal Reserve than the markets were expecting.
Inflation concerns:
Participants remarked that inflation readings had been higher and were more persistent and widespread than previously anticipated.
Faster rate hikes:
Participants generally noted that, given their individual outlooks for the economy, the labor market, and inflation, it may become warranted to increase the federal funds rate sooner or at a faster pace than participants had earlier anticipated.
Balance sheet runoff (not just stopping securities purchases but allowing the central bank’s balance sheet to shrink):
Almost all participants agreed that it would likely be appropriate to initiate balance sheet runoff at some point after the first increase in the target range for the federal funds rate.
Starting balance sheet runoff sooner:
Some participants also noted that it could be appropriate to begin to reduce the size of the Federal Reserve’s balance sheet relatively soon after beginning to raise the federal funds rate. Some participants judged that a less accommodative future stance of policy would likely be warranted and that the Committee should convey a strong commitment to addressing elevated inflation pressures.
And moving faster:
Many participants judged that the appropriate pace of balance sheet runoff would likely be faster than it was during the previous normalization episode.
The markets are now pricing in a high probability of four Fed rate hikes in 2022 as the graph below shows.

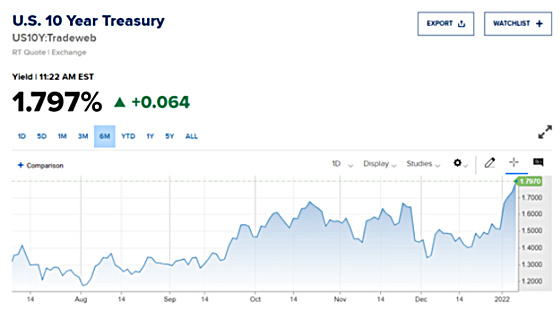
10-year Treasury yields have risen by almost 0.5% since hitting their recent lows in early December 2021.
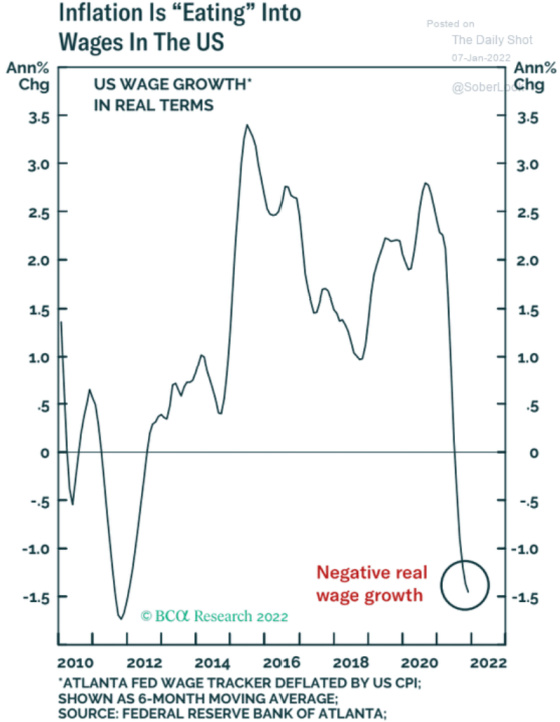
The run-up on Friday was in reaction to the employment report that showed disappointing job growth but strong wage gains and the unemployment rate dropping, which feeds into the Fed’s newfound religion on fighting inflation.
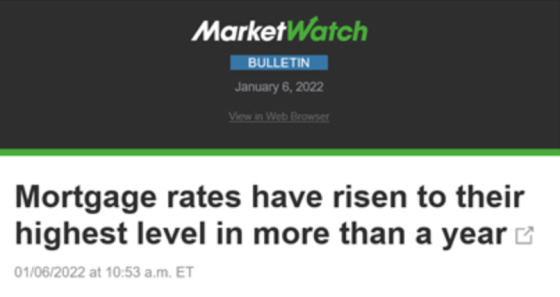
With the Fed now indicating that it will not only stop purchasing Treasuries and mortgage-backed securities sooner than expected (in March versus June), it is also now discussing shrinking its balance sheet, which has not been telegraphed until now. This pushed yields on mortgage-backed securities higher as this will turn the Fed from a buyer into a potential seller of these securities. This selloff flowed through to mortgage rates.

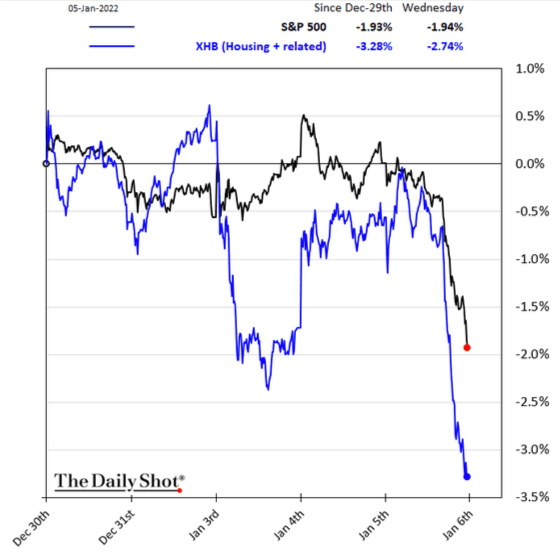
Higher mortgage rates, holding everything constant, should lessen the buying power for prospective home purchasers which is why the stock prices of homebuilders dropped more than the overall market.
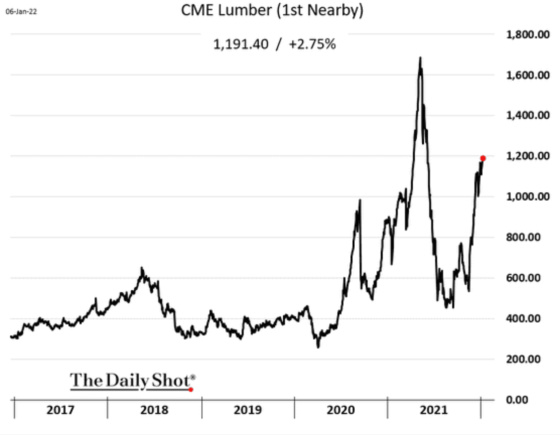
And with lumber prices starting to go up again quite significantly, this doesn’t help their future profitability if they are unable to pass this cost increase onto home buyers.
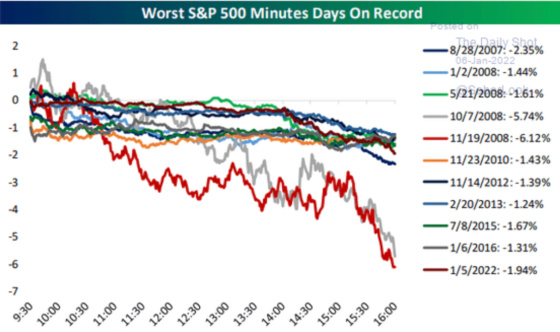
The market’s reaction to the release of the Fed minutes and what was communicated was quite negative as evidenced by last Wednesday’s selloff being the worst reaction to the minutes being released on record.
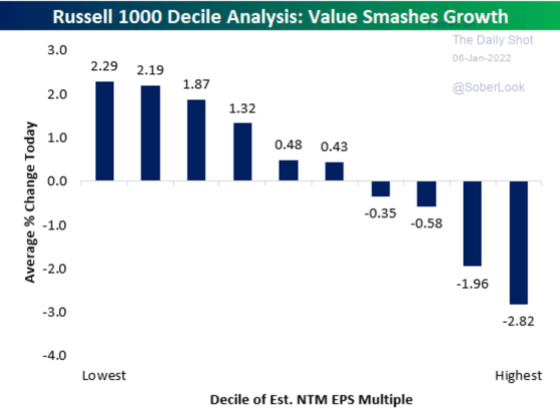
With the prospect of higher rates, investors sold off companies that had the most stretched valuations and rotated to the cheapest securities. This is because in a higher interest rate environment investors can find safer alternatives at higher yields so they don’t need to speculate as much with high-priced stocks that have to deliver strong growth to justify their valuations.
Inflation is now the Fed’s biggest concern and this chart reminds me of the phrase “We have met the enemy, and he is us.” The money supply exploded in an effort to fight the impact of Covid but it sure looks overdone from this chart and its impact on inflation.

Although the Fed no longer believes inflation is as transitory as it once did, the market seems to be pricing in inflation as more of a two to three-year issue. This next chart shows the breakeven inflation rate for 10-year TIPS buyers. This is the rate that purchasers of inflation-protected securities break even on their purchase.
If inflation ends up higher, then they do better and if it’s lower then they do worse than expected. One can see that it is at the upper end of the range but it has not breached it yet. If it follows previous patterns, then it should come down over the next couple of years.

This chart is a bit more esoteric but it reflects investors’ projections of inflation over the five-year period five years from now. Interestingly, future inflation expectations have come down recently in spite of Treasury yields spiking. Perhaps investors are expecting higher yields, tightening monetary policy, and less expansionary fiscal policy to slow down the economy and ultimately inflation as well.

This headline is something that would understandably cause concern for inflation hawks.
The following charts are ones I follow closely because yield differentials between different Treasury maturities can be informative with regard to investor expectations regarding future growth. When the yield curve is steep, which is when long rates are quite a bit higher than shorter-term yields, then this indicates investors are pricing in faster future economic growth. The opposite is the case when the spread is declining, or even inverted with short rates exceeding long rates, which foreshadows very slow growth or economic contraction.
This chart shows the difference between 10-year and 5-year Treasuries. One can see that the spread has been compressing and in every previous cycle, it has continued to get narrower until a recession ensues.

The same is the case for 10-year yields minus 2-year yields.

This next one is particularly interesting in that it is going in the opposite direction as the yield differential between 10-year Treasuries and 3-month Treasury bills has been increasing due to a material rise in the former’s yield. And yet, the previous four recessions were preceded by a rising 10-year minus 3-month yield spread. This makes sense in that long rates initially move higher based on faster economic growth projected and a less accommodating Fed. The 3-month bill yield doesn’t move until the Fed is close to moving rates.
Once the Fed starts raising rates then this puts pressure on the economy and the yield curve tends to narrow with short rates going higher and then long rates coming down in anticipation of slower economic growth. We’re actually at levels now that are similar to when previous recessions ensued.

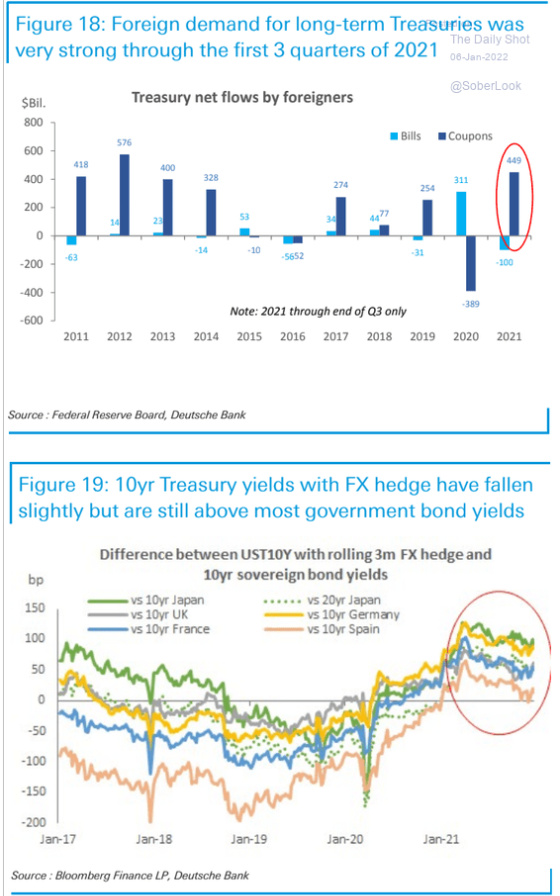
U.S. Treasuries seem to offer compelling value for foreign buyers, which should help keep a lid on how high yields go.
There is a big bet against 10-year Treasuries, which has paid off over the last month, but in the longer term, this should be a catalyst for yields coming down as so many investors are leaning in the same direction of betting on higher rates. As a result, there would be a lot of buying power to purchase Treasuries with investors needing to cover their bets against rates going higher to the extent there is surprise economic news that would be bullish for Treasuries.

This chart is another way of analyzing data from the positioning of traders in the Treasury futures market to come up with an index to indicate whether 10-year Treasuries are at risk of yields moving higher or lower. From the current reading of this indicator, it would appear they could be positioned for yields to come down.

I’ll leave you with another set of lyrics from Minute by Minute to capture how I’m feeling. I have been on the variable rate bandwagon for the last 18 years or so and fortunately, our investors have benefited from this as it has produced a lower cost of debt with much greater pre-payment flexibility than the fixed-rate alternatives. Admittedly, however, in this post-Covid environment, my degree of conviction has lessened somewhat due to very little historical precedent for what we’re experiencing.
We were cruising at 75 miles per hour and then suddenly had to hit the brakes only to then have a huge gale-force wind of monetary and fiscal stimulus push us forward with great acceleration again. As a result, we are contending with huge disruptions in society and our economy that have very little precedent other than maybe wartime experiences.
The Fed has clearly shifted and I think it will be focused on bringing the money supply down or dramatically slowing the growth rate. This could cause short-term pain as they start to move rates higher, but I still think in the longer term that this will slow the economy and not allow short-term rates to come anywhere close to the last cycle peak of approximately 2.50%.
But minute by minute by minute by minute
I keep holding on
Oh, minute by minute by minute by minute
I keep holding on
Leave a Reply