
I have always been fascinated by economic cycles. What I have learned over the years is that financial excesses that reverse into fear and revulsion are often catalysts for economic downturns. Real estate, commercial and/or residential, are often culprits because they are assets that can be leveraged which can magnify returns as well as often being influenced by tax advantages which can stimulate demand beyond its longer-term trend. It can also lead to enormous capital flows and investments, a lot of which can be very speculative at the end of the cycle. Add to this the multiplier effects of huge construction and remodeling spending, commissions, the extraction of equity via refinances, legal fees, title fees, etc., and the real estate cycle can be a very powerful economic driver.
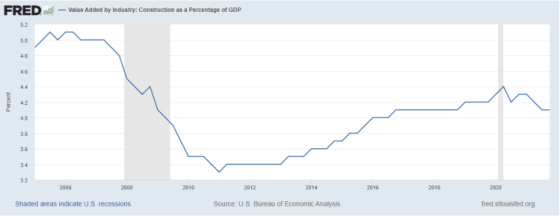
One can see from this chart that residential construction as a percentage of GDP was materially higher during the housing bubble of 2005-7 than it is today. For this reason, I don’t believe that a housing slowdown will have a very detrimental impact on the economy given that it’s not as reliant on housing construction. We won’t be immune to its negative impact, but since we’re not as reliant on it in terms of economic output as we have been in the past, it shouldn’t be catastrophic.
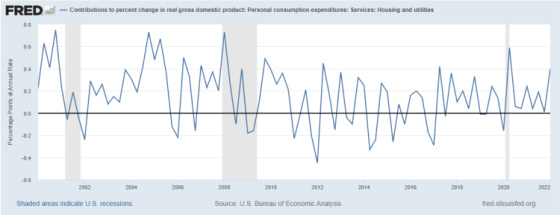
And while other aspects of housing consumption are higher than average, it’s not in excess territory.
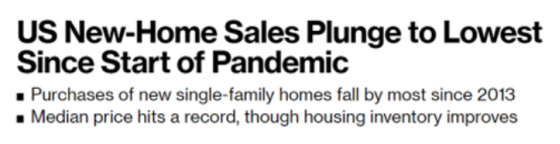
The first sign of a housing slowdown comes with transaction volume contracting. One can see that this is starting to happen.

And higher mortgage rates appear to be impacting new home sales particularly hard.
It will be interesting to see if the economy slows down without material stress in housing. History would say that it’s not very likely.

One exception to this was the Covid recession in which housing came through with flying colors in terms of experiencing minimal stress and coming out the other side extremely strong.
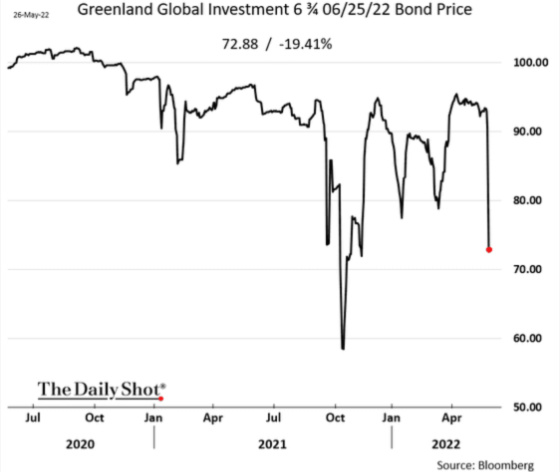
And while housing should probably manage through a downturn without a lot of stress because of the strong underwriting of borrowers and homes being in financially strong hands, the same is not true for China. Chinese developers are having a more difficult time repaying their loans to Chinese banks or keeping them current as the following chart shows.

Many developers have their bonds traded publicly so their prices can be indicative of stress. This is a Chinese developer whose bonds are dropping a lot in value once again which indicates the risk of default is quite high as this bond is maturing in a month.
Chinese GDP statistics are notoriously unreliable because of huge pressure for officials to show certain output results. This requires alternative methods of estimating Chinese economic output. Here is one estimate and one can see the gap is quite large between the officially reported Chinese GDP and this estimate (Capital Economics Activity Proxy).
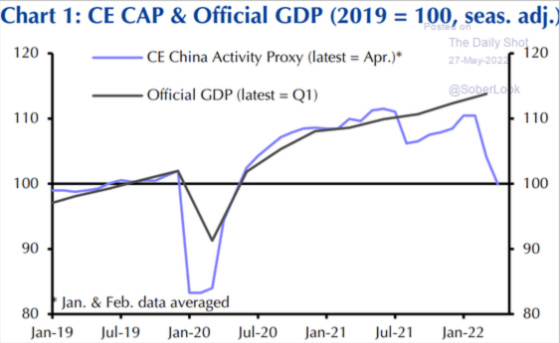
So why such a large gap?
I think from the following charts it will be obvious that it’s housing-related and Covid lockdowns as well. Let’s start with the latter, which is quite a shocking chart.
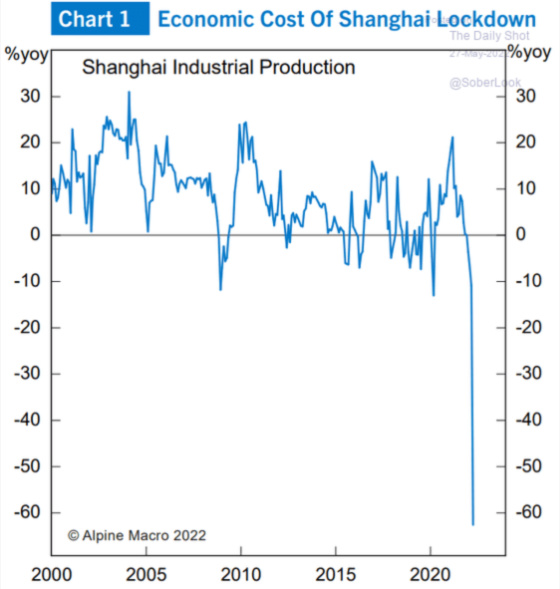
With so many people locked down in China, particularly in Shanghai, production has dropped significantly, as well as consumer spending. This is not an environment that is very conducive to building or sustaining consumer confidence and having people want to purchase a home. There also seems to be more of a groundswell of young Chinese who want to leave the country in the wake of such overbearing lockdowns and restrictions. This too will put pressure on demand.
So what do the charts show about housing trends in China? They’re not pretty.
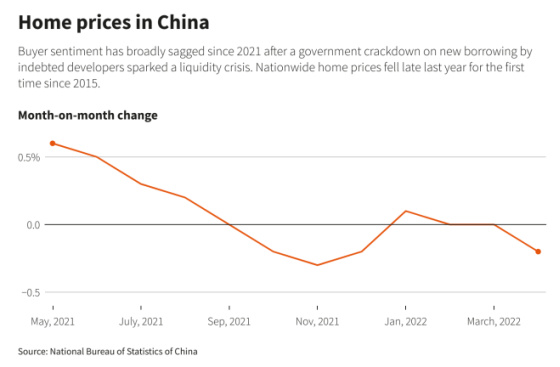
Very few cities are reporting homes going up in value.

This chart shows how prices have started to go down.
Before prices go down, sales volumes usually drop and one can see that this has been the case in China for more than a year while prices have only started to drop.
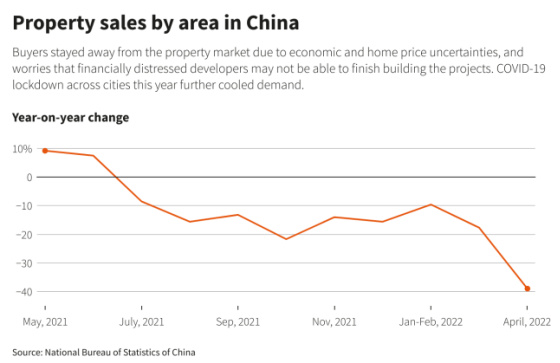
Given the immense financial challenges faced by developers, they are in contraction mode to preserve and generate cash. Ultimately this minimal growth in supply should serve to create more balance with diminished demand.

Here are a few other charts with a little bit longer frame of reference.

China is hugely impactful in terms of global economic growth. With its relentless Zero Covid policy along with a very weak housing market, one of the world’s engines of growth is clearly stuttering. Is it now the case that when China sneezes the rest of the world catches a cold?
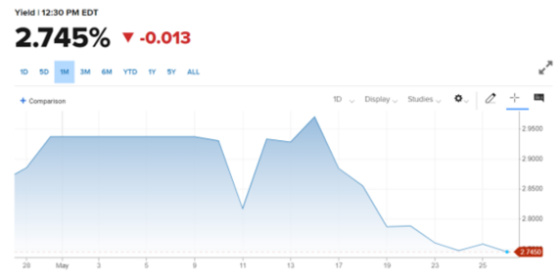
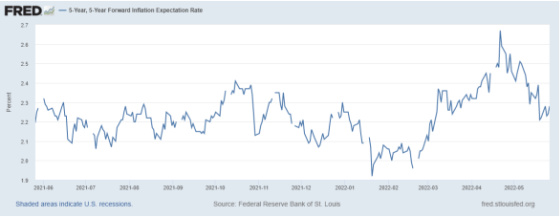
Could the nearly 0.50% drop in long-term interest rates and diminished inflation expectations have anything to do with weakness in China?

Leave a Reply