
We finally had a CPI report that the market responded favorably to. The prior six releases led to market losses. Last week’s report led to a nice gain.

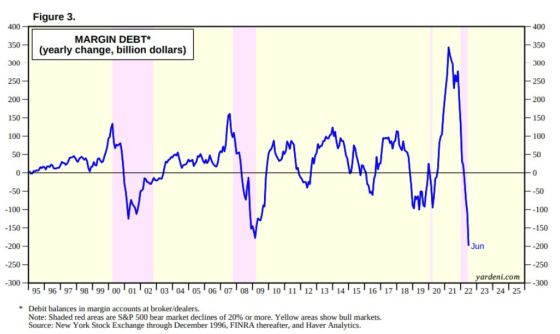
As an aside, this chart shows how incredibly fast margin debt went up and now down during the bear market that just took place. This is a potential source of buying power if investors choose to re-leverage in the future.
Investors seem to be looking far ahead and pricing in that the rate of inflation has peaked and will start coming down fairly significantly. This should give the Fed cover to take its foot off of the monetary brakes. The Fed is pushing back on this, however, because it’s still spooked by the information conveyed in this chart. Yes, it may have peaked, but there’s still a long way to go before it bottoms out and stabilizes at an acceptable level.

And yet, a number of firms are modeling a sharp deceleration in the rate of change in the CPI index and its core subcomponent.


Bank of America and Deutsche Bank have similar trajectories and CPI stabilizing in the 2% to 3% range.
I discussed last week how the Fed was on a mission to “liquidate labor” in order to slow demand and have it better calibrated with supply. I also expressed some skepticism regarding the jobs report that showed robust job creation. The household survey has shown the opposite over the past few months. When combined with other economic indicators, I was leaning toward the household survey being more right than the establishment survey.
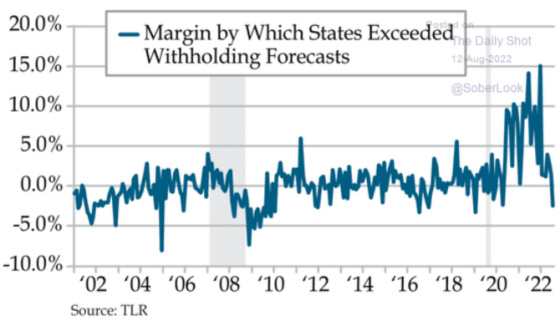
A very good real-time indicator of the health of the employment market is payroll tax withholding data from the states. This captures movement in job and wage growth pretty well. Of course, wage declines can mask job growth and vice versa, but all in all, it’s a good proxy. One can see from this chart that the trend is not very favorable in terms of withholding dollars exceeding forecast. After blowing away their budgets for most of 2020 and 2021, states are now seeing payroll tax collections coming in below forecast.
If this data from the midwest is representative of the rest of the country, then we are seeing very weak business conditions for both manufacturing and non-manufacturing sectors.

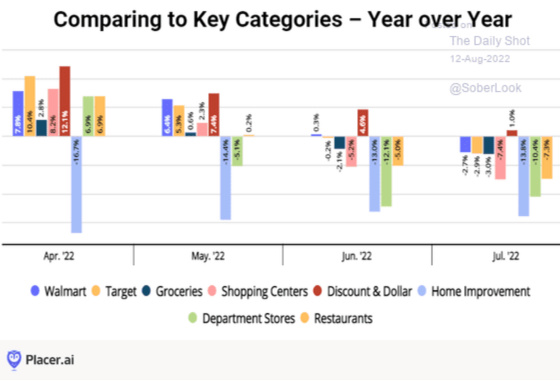
I thought this chart was quite interesting. Store visits appear to be dropping fairly meaningfully and rather quickly. There is already too much inventory at major retailers like Walmart and Target. This suggests that this is not going to be alleviated any time soon.
According to Deutsche Bank, its calculations show that monetary policy is tighter than the Fed’s policy would suggest, which is potentially another economic headwind.

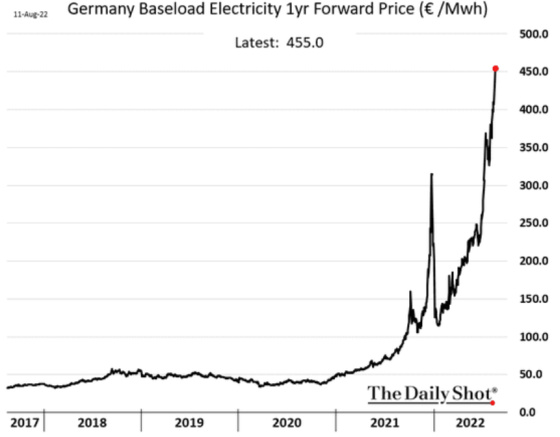
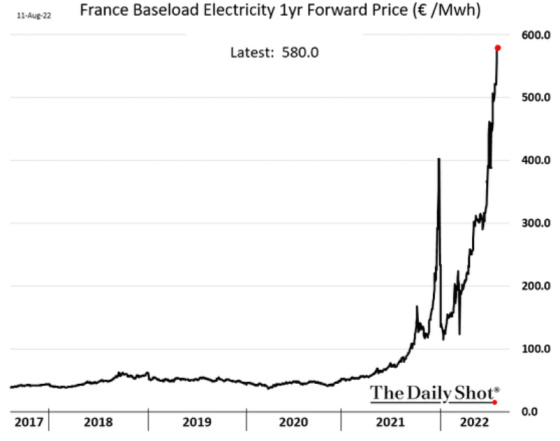
Throw in incredibly high European electricity prices, particularly in Germany and France, and we don’t have a lot of international momentum, especially when you add in China’s real estate woes, to propel the global economy ahead.
This graph is a good representation of how significantly the Chinese economy has slowed due to its real estate overbuilding.

If a recession does ensue, then history would suggest that the labor market will not be spared. The average job loss from peak to trough has been in the 2% to 3% range, with the Great Recession having been a significant outlier with jobs having contracted by approximately 6%.

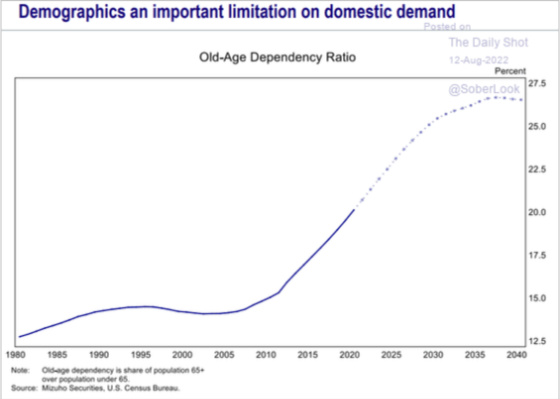
One of the pressing challenges for the labor market is the low labor force growth that has materialized and looks to continue. Our population is aging fairly rapidly, which will put pressure on labor force growth.
This graph shows how the ratio of older people to younger will grow significantly over the next 20 years.
The slowing growth of our labor force can have a yin and yang effect in terms of Fed policy. If labor is in too short supply, then it can be inflationary, which would necessitate tighter monetary policy and higher rates. At the same time, this will also lessen the country’s economic potential unless there is a tremendous increase in productivity. Firms will be highly incentivized to invest in labor-saving or substituting tools like robots, digitization, artificial intelligence, etc. The lower growth potential should help keep interest rates lower, but it’s also predicated upon increasing labor productivity through more investment in automation and digitization.
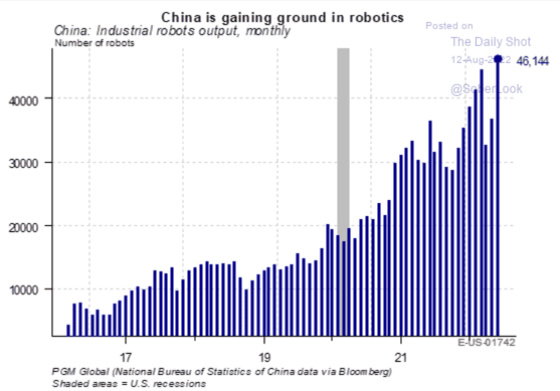
China is an example of a country investing heavily in robots. Its labor force is now at the beginning stages of a very dramatic drop due to its one-child policy having firmly taken root over the past few decades. This graph shows how China is increasing its output of robots quite significantly.
Our labor productivity is currently atrocious. It’s not easy to measure, but the fact that it’s so low may be an indication that the employment report is overstating the number of jobs in the economy. A smaller denominator (less jobs) would result in productivity being less negative and closer to historical ranges.

One of the reasons that productivity, and economic output, is so challenging to measure is because the economy has changed dramatically over the past 40+ years. It’s gone from one being based on tangible assets to one that is overwhelmingly driven by knowledge-based, software-oriented intangible assets.
It’s an economy that is becoming increasingly reliant upon brains over brawn.Click To Tweet
One public policy issue that is extremely important but highly emotional is immigration. One can see from this chart that immigrant labor has recovered some but is definitely below trend. The U.S. has historically had one of the most dynamic labor markets that have been welcoming to foreign talent to help our economy grow and innovate. With domestic births dropping along with birth rates, this issue will become even more important. Given the polarization in our society and politically, I’m afraid we may be very short-sighted in the decisions we make in terms of this vitally important issue.

As I wrote about last week I think the Fed is on a path to hurt the labor market in what appears to me as an increasingly softening economy. Of course, the Fed’s policy measures will serve to create further headwinds as employers may become less inclined to fill positions or invest in growth if they feel like the Fed wants to bring about a recession. This is a cyclical challenge. On a longer-term, more secular basis, however, we are going to have to do what we can to expand the supply of labor and to make our workforce more productive and prepared to compete in the 21st-century knowledge-based global economy.
Leave a Reply