
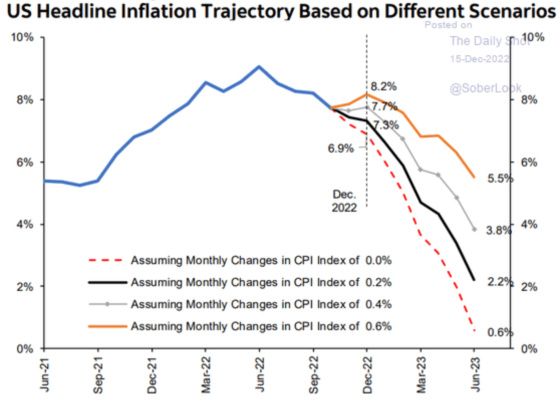
I think this chart is what keeps Jay Powell up at night. If he were convinced beyond a reasonable doubt that we were still in the same low inflation regime that had been present for decades prior to Covid, then he would not be talking so hawkishly and paying little heed to the Fed’s actions triggering a recession.
![]()
Based on current trends, however, inflation should return to a range of 2% to 3% by mid to late 2023, although this chart shows that there are scenarios in which it can remain above that level.
Investors are still pricing in inflation, stabilizing in the range of 2.50% as the base case scenario.

In spite of very favorable inflation trends,
Powell is haunted by the fear of making the same mistake as Fed Chairman Arthur Burns, who took his foot off of the brake by loosening monetary policy too soon only to see inflation spike again between 1978 and 1980.Click To TweetConsumer Price Index (CPI)
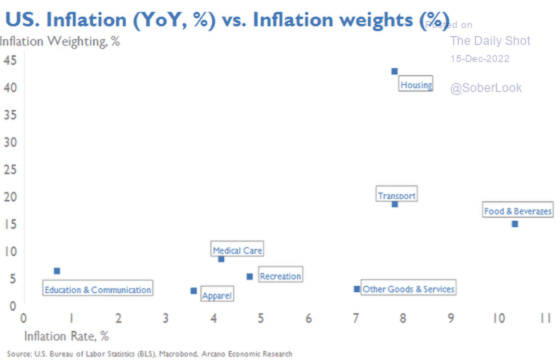
I have written about this before, but when it comes to inflation measurement via the Consumer Price Index (CPI), all roads lead to housing costs. This chart shows how heavily weighted housing is in the index and how elevated its rate of inflation has been. Quite simply, if you can break the back of housing-related costs, then CPI will follow.
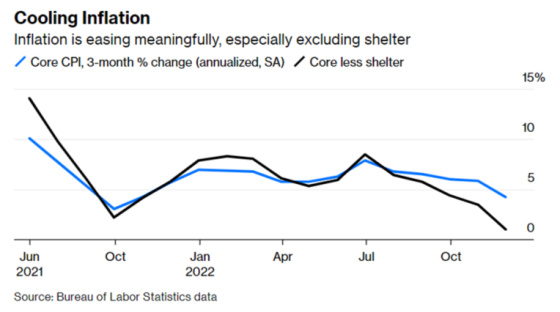
This chart shows Core CPI, which excludes food and energy, while also backing out shelter (housing costs). Non-housing-related inflation has started to turn the corner on an annualized basis, while the last two months it has been negative. If these trends continue then, Core CPI ex-Shelter should drop significantly over the next six months.

Here is another chart showing Core CPI and Core ex-shelter but based on a 3-month % change annualized. Ex-shelter is approaching 0%.
Here are a few key subcomponents of shelter that show how elevated inflation has been in the housing arena.


Unfortunately, the way housing indices are constructed related to rent, they are lagging in problematic ways since they don’t reflect the more real-time activity of new leases being signed because they’re based on those already in place. Here is a more detailed explanation of why housing inflation indices have a strong lag effect.
The CPI for “shelter” has historically lagged home price changes by four quarters, which suggests that shelter “will continue to put upward pressure on overall inflation through the first half of 2023,” according to deRitis.
The lag effect is largely due to how long it takes for leases to roll over into a new contract. Landlords typically renew leases every 12 months, which means current price dynamics won’t be reflected in new contracts for a year.
In this sense, housing is somewhat of an outlier among other CPI categories. Consumers don’t agree to pay the same price for chicken or eggs for a whole year, for example.
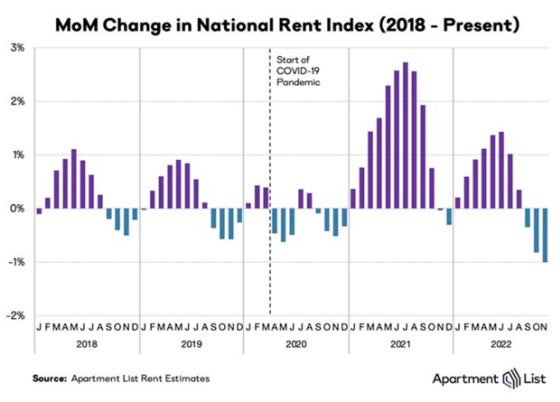
1987 was the year that the Bureau of Labor Statistics changed how it measured housing costs for the CPI. Up until 2021 its methodology didn’t lead to material distortions in the inflation rate. Everything changed with Covid, however, as housing prices and rents skyrocketed. This led to CPI being dramatically understated when rents were spiking but now that the percentage change in new leases being signed is dropping in many instances, it is overstating CPI. This chart shows the Covid spike in rents in 2021 and the first half of 2022 while also showing how rents on a national basis are dropping, although still significantly higher than they were prior to Covid.
If the Fed wants to wring inflation out of the system, then it must deflate housing for a period of time. In order to do this, it has to increase the cost of capital for builders, home purchasers, and homeowners so that economic activity will contract in the areas related to construction, housing transactions, and remodeling. This is clearly happening. And yet, ironically, if it does this for too long a period of time, then it will be setting the stage for housing costs to go higher as new supply will contract, and an even greater imbalance between supply and demand will materialize, which will lead to reigniting inflation in the housing sector.
As often is the case during periods of dislocation, the Fed is balancing short-term needs against long-term costs. I think the Fed knows it can’t compress housing activity for too long without sowing the seeds of future inflation. This chart shows that the market is firmly convinced that the Fed will have to cut rates sooner rather than later, and the longer it waits, the more damage it will do to the economy and will lead to a greater imbalance between supply and demand. And when rates have to drop due to the economic contraction or material weakness brought on by the Fed, then housing demand will be stimulated again, which should put upward pressure on prices and rents. It will take time to generate new supply to moderate price and rent increases.

If history is any guide, then we are very much approaching the peak in short-term rates. This chart shows the yield of the 2-year Treasury note versus the Federal Funds Rate. This is the fourth tightening cycle since 2000. During the first two, rates peaked when the Federal Funds rate approached or slightly exceeded the peak in the 2-year yield, while in the last cycle, it never quite got that high. Each time this took place, a recession ensued. Assuming the 2-year yield reached its peak on November 7 at 4.72% (it’s currently 4.17%) and with the Federal Funds rate now between 4.25% and 4.50%, we shouldn’t be too far from the peak.

This chart shows that the market is betting on the Fed raising the Federal Funds target to 4.50% to 4.75% at its February meeting.
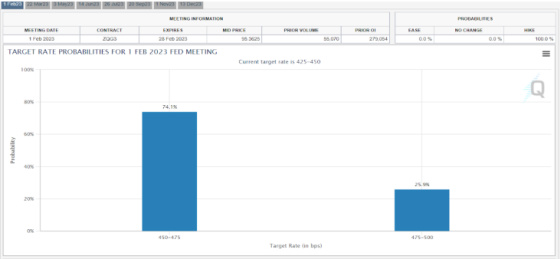
For the March meeting, the odds are on the Fed increasing the fund’s rate to between 5.00% and 5.25%.

That is where it should peak, which would be about 0.40% higher than the peak 2-year Treasury yield since, after that meeting, the market is projecting the Fed to start cutting rates in June 2023.
In a recent speech at the Brookings Institute, Fed Chairman Jay Powell concluded his remarks with the following:
Given our progress in tightening policy, the timing of that moderation is far less significant than the questions of how much further we will need to raise rates to control inflation and the length of time it will be necessary to hold policy at a restrictive level. It is likely that restoring price stability will require holding policy at a restrictive level for some time. History cautions strongly against prematurely loosening policy. We will stay the course until the job is done.
So how long will the Fed have to keep the Federal Funds rate at its peak level? It stayed there for eight months between May 2000 and November 2000, for 12 months between July 2006 and July 2007, and nine months between December 2018 and July 2019.
The market is currently betting on it reaching its peak in March and only staying there for three months. This is definitely contrary to Powell’s tough talk and historical precedent, so this tells me that investors are banking on the labor market cracking in ways that will require the Fed to reverse course. And that is where the challenge lies as this chart shows.
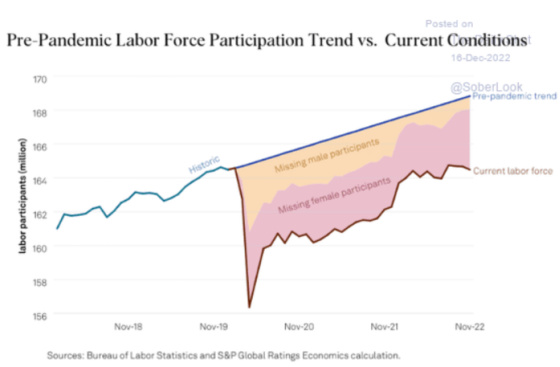
There has been a huge drop in the labor force, especially compared to the pre-Covid trends. This has resulted in labor shortages, particularly in the service sector, and strong wage growth.
Powell seems to agree, as this is how he summed up the current inflation fight.
Let’s sum up this review of economic conditions that we think we need to see to bring inflation down to 2 percent. Growth in economic activity has slowed to well below its longer-run trend, and this needs to be sustained. Bottlenecks in goods production are easing, and goods price inflation appears to be easing as well, and this, too, must continue. Housing services inflation will probably keep rising well into next year, but if inflation on new leases continues to fall, we will likely see housing services inflation begin to fall later next year. Finally, the labor market, which is especially important for inflation in core services ex, housing, shows only tentative signs of rebalancing, and wage growth remains well above levels that would be consistent with 2 percent inflation over time. Despite some promising developments, we have a long way to go in restoring price stability.
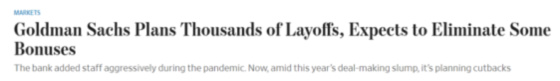
We could find ourselves in a bifurcated labor market in which high-paying white-collar jobs may be more at risk because of the capital excesses that have occurred in tech, private equity, investment banking, some aspects of real estate, etc.. In contrast, more blue-collar or service-oriented jobs hold firm. Major job cuts have been announced in the tech sector, with Meta being the most notable. Add financial services to the mix with this announcement from Goldman Sachs last week.
Fed policy is clearly targeted at lowering housing costs which should work for a period of time. On the other hand, if it stays too tight for too long because of wage gains, then the seeds will be sown for a worse housing shortage down the road after the labor market finally cracks, and interest rates will have to go down to much lower levels. This should stimulate renewed demand for housing as mortgage rates drop but at a time when supply is limited because building contracted sharply.
There is a lot to process and think about and so many yin and yang effects that it can make one’s head spin. It’s also what can make my job so fascinating.
Leave a Reply