
It is notoriously difficult to separate the signal from the noise when it comes to investing. What information is truly meaningful enough to take action that can lead to making money or avoiding loss versus useless information that leads to decisions which bluff us in or out and lead to lost opportunity or losing money?
One of the great things about being in the apartment business is that it is fairly simple to analyze it on a macro basis. Of course, the devil is in the details in terms of buying a property at a good value in a growing area that maintains its appeal for many years. On a national basis, however, it is not too difficult to get a feel for whether housing is under-supplied, over-supplied, or in balance.
Housing – Stay the Course?
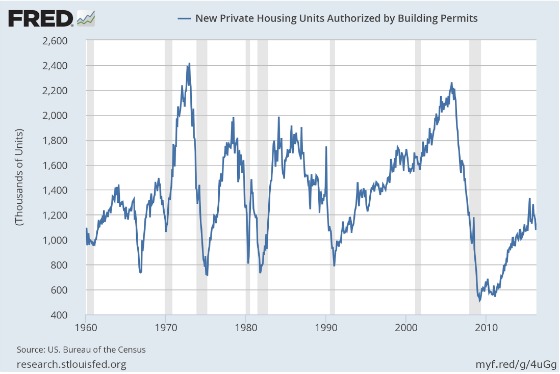
The number of homes, apartments, and condominiums under construction and being permitted for construction is very easy to see from numbers released by the Census Bureau. The following graph shows the history of housing starts in the United States since 1960.

It’s pretty clear that we are now producing about 1.2 million new housing units nationally. This is up significantly from the trough and still way off from the peak. What about future supply since these units have been started? For this, we turn to permits. Building permits reached about 1.3 million units and have now fallen back below 1.2 million. Since I prefer to be generally right than precisely wrong, let’s say that supply is somewhere in the 1.1 to 1.3 million range.
Supply is much easier to peg than demand since it is quite difficult to get good, real-time numbers on household formations. This data tends to come out after the fact when census information has been collected. Nevertheless, we can infer from other data as to whether demand is less than supply, in balance, or greater than new units being built. These include the Case-Shiller Index which tracks pricing, how long it takes for homes to sell and vacancy rates for rental units.
The S&P/Case-Shiller index has shown continued growth since bottoming in 2012 for the 20 cities it tracks. It is still below the peak in 2007 but it has been on a nice, steady upward progression for the last four years.

From an inventory standpoint, the market seems to be tight if history is any guide. While it has been lower, it is definitely on the lower end of the historical range.

The rental market continues to remain strong as the vacancy rate has come down significantly from the peak for all forms of rental housing.

All of the current signals suggest there is more demand for housing than supply. If we are pegging supply in the 1.2 million range per year for the next few years, what is a good estimate of demand? For one forecast there is a recent research report from the San Francisco Fed. The researcher looked at historical data regarding household formations by age group and crunched a lot of numbers. Rather than spending time on the methodology, I will cut to the chase with his conclusion. Here is how he wraps up the report:
“To the extent that headship rates among various age groups stabilize, household formation can be expected to more closely follow the growth in adult population. In that regard, the most recent Census Bureau projection for the 18 and older population is about 1% per year, on average, through 2020. In that baseline projection, older age groups tend to have the highest growth rates. Since the older group also has traditionally higher shares of heads of households, this should mean a higher headship rate overall. Given current 12-month annual headship rates by age group, the Census Bureau projections imply household formations averaging on the order of 1.4 to 1.5 million per year through 2020. That compares favorably to an average of a little less than 900,000 annually over the past five years.”
So there you have it. The data and research suggest we should continue to experience an under-supply of housing in the United States for the next four years or so assuming that new supply stays in the 1.2 million range with demand in the range of 1.4 to 1.5 million. I know from an apartment standpoint that banks are tightening up their construction lending and, when combined with higher construction costs, will make it more difficult to meaningfully increase new supply from where it is today. I also believe that the trend of mortgage lending being highly concentrated in higher credit borrowers will continue as this chart depicts.

Absent some unexpected economic reversals which curtail demand (yes the jobs report was very weak so this is not an insignificant risk), from what I can see from the data and forecasts for household formations, housing should continue to experience price appreciation for owners and solid returns for apartment investors.
Over to You:
Where do we go from here? With housing demand exceeding supply and weak job numbers, we are well positioned. I’d like to hear from you. What are your thoughts?
Just wondering how you factored in the aging boomers who own homes but will be selling them at increasing rates. Is this increasing the suppy?
Thanks for the usual enlightening analysis, Gary.