
Introductory note: I wear contacts and glasses, so that’s why I have four eyes paying close attention to the 2-Year Treasury Note yield.
The Federal Reserve has embarked on six tightening cycles since 1988, with the most recent having commenced in March 2022 and one that is still in process. In last week’s blog, I touched on the 2-Year Treasury Note being a pretty good benchmark to help predict at what rate the Federal Funds Rate (FFR) may reach its peak. It’s a short enough maturity to be influenced by Fed policy but long enough to where it can also be a good predictor of future pivots in Fed policy.
I have generated graphs of each of the six tightening cycles to see if we can learn anything that can be applied to the current aggressive Fed hiking cycle.
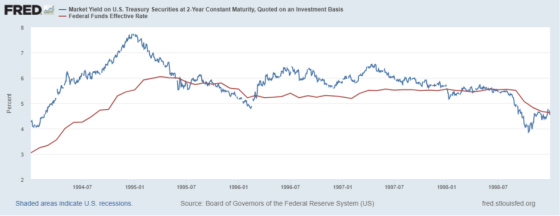
In general, when the Fed reaches the peak of its tightening cycle, the most important indication of this is when the FFR exceeds the yield on the 2-Year Treasury yield for at least a couple of months. Click To TweetThis first chart shows the rate hike cycle from March 1988 through March 1989, there was a brief time in which the FFR exceeded the 2-Year yield, but it was fleeting, so that was a false positive. It breached the 2-Year yield in January 1989 and stayed above that with a very brief exception in March. The FFR started to come down beginning in June 1989, five months after the first sustained breach. What is clear, however, is that when the 2-Year started dropping materially, then it was a strong indication that the Fed would start taking its foot off of the brakes.

This next rate hike cycle is a bit tricky as the 2-Year yields were very close between June and November 1995, with no sustained breach until December. This indicated that the Fed was reaching its peak for the FFR during this cycle, and the bias for the next move in rates would be down. And this is what happened to begin in November 1995.
This cycle also had another mini-rate cut resulting from the Asian currency crisis and the implosion of Long Term Capital Management in 1997 and 1998. One can see that during this time, the FFR breached the 2-Year, which led to rates being cut after a long period of stability.
Beginning in June 1999, the Fed embarked on another tightening cycle that reached its peak in June 2000 as the implosion of the dot com boom was starting to play out in full force. At this point, the FFR breached the 2-Year yield and stayed there for a sustained period as the Fed held rates while the 2-Year yield dropped quite a bit.
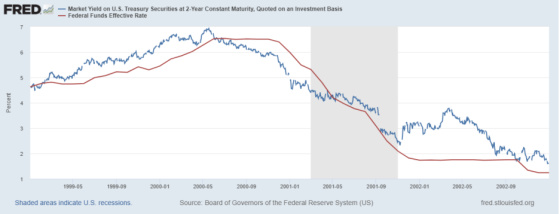
This next chart is similar to the previous two hiking cycles as the two yields moved quite close together between March 2006 and July and then, while the Fed continued to hold rates steady, the 2-yield started to crack, foreshadowing a change in Fed policy to rate cuts, culminating in emergency measures with the subprime collapse.

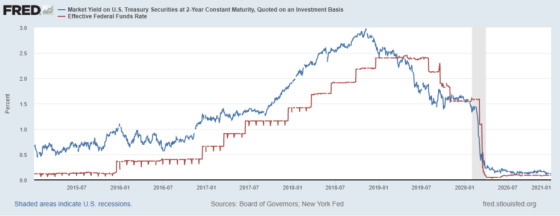
In 2015 the Fed started raising rates again and kept moving the FFR higher until late 2017. Then, it kept it stable until July 2019, when the heat was really building from Donald Trump and the financial markets that Chairman Jay Powell was keeping rates too high and monetary policy too tight. The FFR started to breach the 2-Year yield in April 2019, and then the 2-Year dropped, leading the Fed to follow. In the wake of Covid, it exceeded the 2-Year again, and both rates fell off a cliff.
All of these previous cycles were analyzed to help us with today and where we might be headed. Like all of the other cycles highlighted in this post, one can see that the initial rate hike trajectory was corroborated by the steady rise in the 2-Year yield during this cycle. This has now changed, however. The FFR has now finally broken through the 2-Year yield. The FFR range is between 4.25% and 4.50%, assumed to be an average of 4.33%. As of this writing, the 2-Year Treasury yield is 4.32%. This is up from its recent lows of 4.17% and down from its peak of 4.73%. We will see if this is a sustained breach.
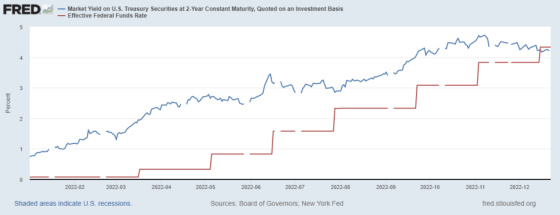
The market is assigning a 66% probability that the Fed will bring the FFR to between 4.50% and 4.75% during its February meeting and a 56% probability of another hike to between 4.75% and 5.00% during March. After that, the market is projecting the Fed to hold rates, but if it were to bet over or under, it would pick another hike, although the probabilities are not definitive at this point.
Here is the chart of the 2-Year Treasury Note. One can see the recent peak, decline in yields, and recent increase.
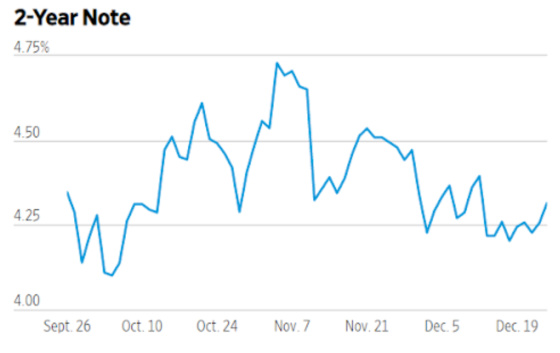
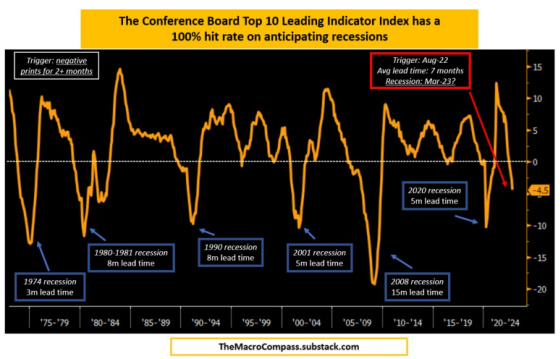
This may be a risky declaration, but if we accept that 4.73% was the peak in the 2-Year yield and the Fed brings the FFR to an average of 4.87%, it does appear that the peak is at hand. And with the average annual change in the Leading Economic Indicators having dropped two months in a row and this has a 100% success rate in predicting recessions, it’s understandable as to why the market thinks the Fed is approaching a peak in the FFR since the average lead time to a recession is seven months, which would mean March if this follows the historical averages. Even Powell’s recent statements suggest this may be the case. He is keeping open how long rates may stay at the peak, but he is definitely hinting that a peak is much closer now than it has been in a while.
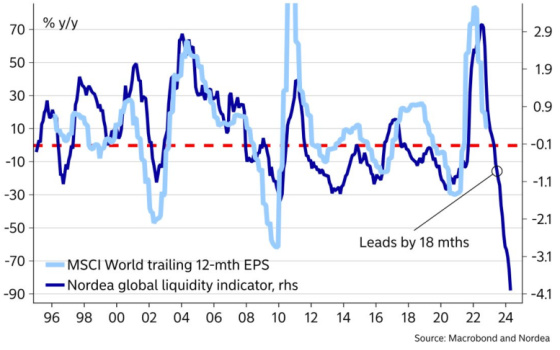
Finally, global liquidity is contracting at pretty alarming levels based on this chart. This reflects how monetary policy acts with a lag and at this point, is not something that Powell has been willing to take into consideration. He is very much in the here and now in terms of stifling inflation, and he’ll work on whatever negative ramifications may arise from this down the road. This chart suggests that corporate earnings could be very much at risk over the next 18 months.
I hope you had a wonderful Christmas holiday and keep paying close attention to the yield on the 2-Year Treasury Note!
Leave a Reply