
I feel for Joe Biden. I really do. No President is solely responsible for economic ills or gains as there’s a continuum that carries over from previous administrations and policies. There are too many forces and variables in play to ascribe blame or credit entirely to an administration. There’s often a lot of blame or credit to go around as well as luck and bad luck. This is an aside but I think he and his team did a masterful job of publicizing vital intelligence about Russia’s plans to invade Ukraine. I was really impressed by how that was handled.
Unfortunately, I have to say when it comes to the economy, however, I think Mr. Biden is not correct, although I understand why he wants people to believe that a recession is not imminent.

CEOs are becoming increasingly pessimistic. I have been writing about my concerns regarding a recession for a while now and it has definitely become much more mainstream thinking after the Fed’s very aggressive 75 basis point increase in short-term rates last week.

The stock market seems to be in the camp that there’s something rotten in Denmark, much to the consternation of the Biden administration, as this is the third-worst start to the year in history.

And how about this for historical precedent?
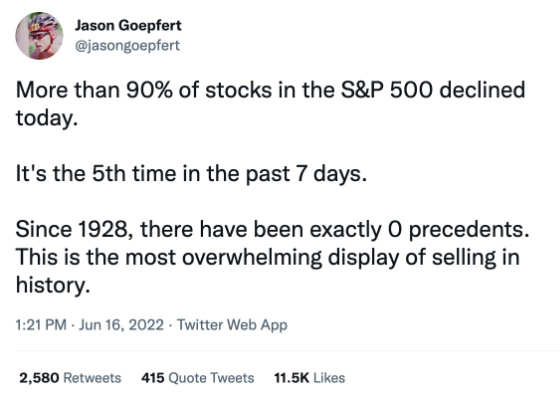
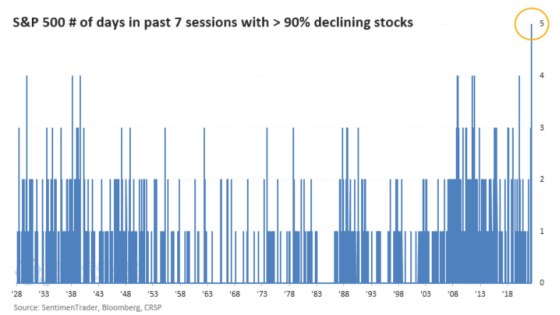
Here is the chart to corroborate the tweet.
And to put this disastrous start in context, here are the 10 worst calendar year returns.
1) 1931: -43.8%
2) 2008: -37.0%
3) 1937: -35.3%
4) 1974: -25.9%
5) 1930: -25.1%
6) 2002: -22.1%
7) 1973: -14.3%
8) 1941: -12.8%
9) 2001: -11.9%
10) 1940: -10.7%
If the year ended as of last week, it would be the sixth-worst year on record. We have another 6+ months to go so we’ll see what happens.
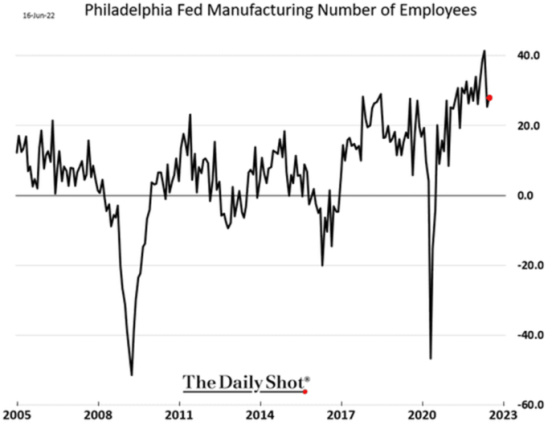
On the positive front, the labor market still appears to be quite healthy if the manufacturing sector is a gauge.
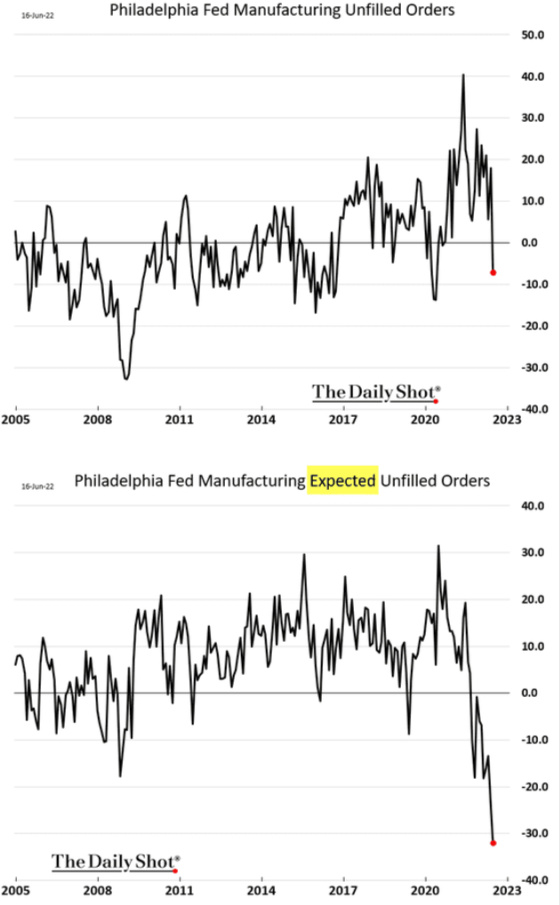
Unfortunately, the expectations for labor demand are dropping quite precipitously.

Real-time labor market indicators are starting to soften for the overall economy as well.

Wells Fargo sees the unemployment rate hitting 5% in 2024.

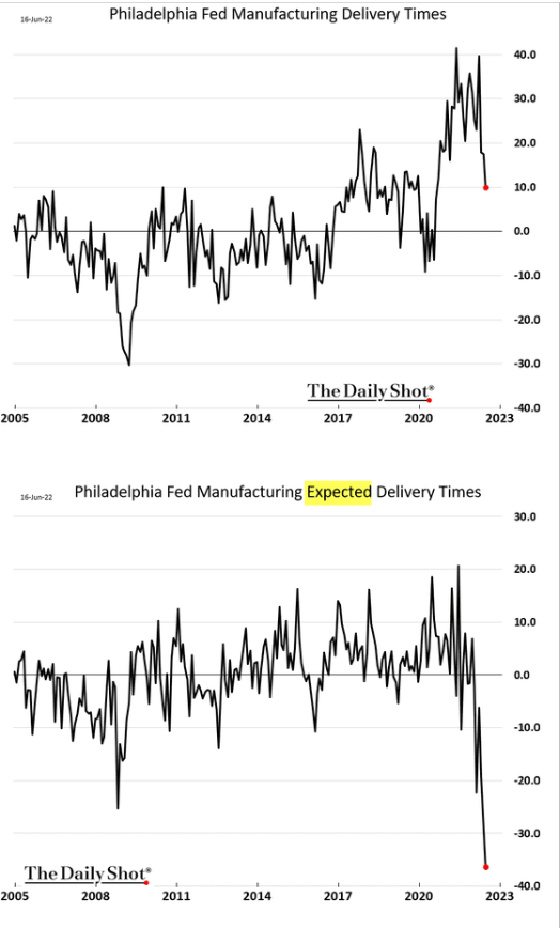
One of the big issues in the global economy, and presumably a driver of inflation, is the snarled supply chain. If these charts are any indication, then this might be coming to an end.
Delivery time expectations are crashing to 2008 levels which indicates manufacturers believe that they should have no trouble getting inputs from their suppliers over the coming months.
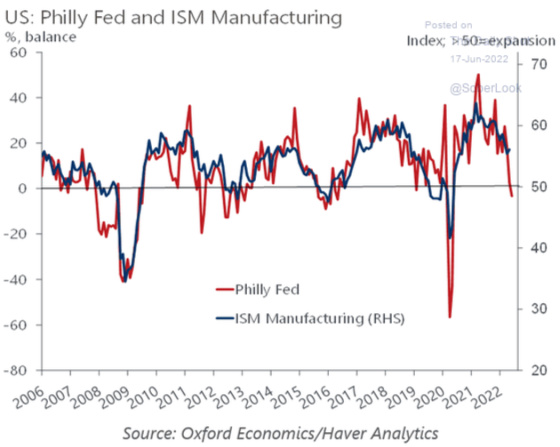
And from this chart, it appears that manufacturing on a national level is already contracting or will be soon.
A big driver of the deeper slowdown in economic activity is the much tighter financial conditions which is a byproduct of the higher cost of credit and more conservative underwriting standards. Previously the Fed would have started to loosen monetary policy and cut rates when conditions got this tight. Now it has just started to raise rates with a very aggressive path for continued hikes at the same time it will begin to embark upon quantitative tightening by shrinking its balance sheet. We are swimming in perilous waters right now.

And of course, higher interest rates are bleeding over into mortgage rates which have shot up dramatically.

This has pushed monthly payments based on the median home price massively higher.

Here is a breakdown of payment changes by loan size.

And here is the cumulative impact of higher mortgage rates for a borrower who keeps his or her mortgage outstanding for the full 30-year term.

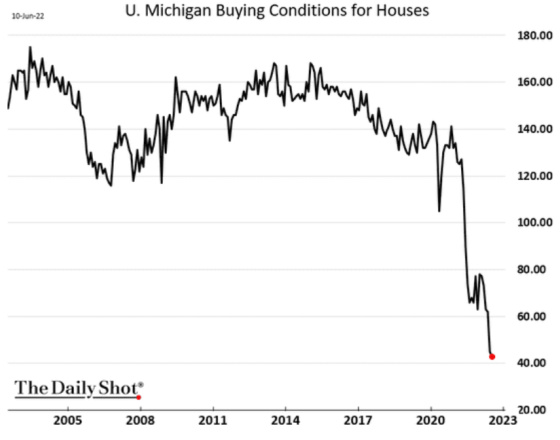
This has cratered consumer sentiment in terms of people’s beliefs about whether this is a good time to purchase a home.
With higher rates and deteriorating consumer sentiment, builders have become more pessimistic as well.

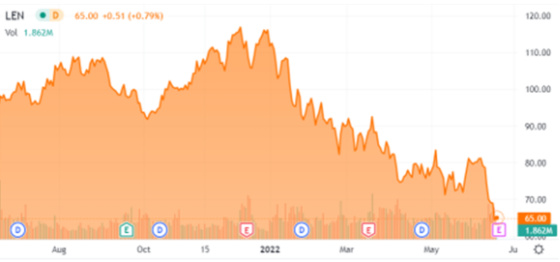
The stock prices of homebuilders have been hit very hard since the beginning of the year. Here is the chart for Lennar, which is down approximately 44% from its peak.
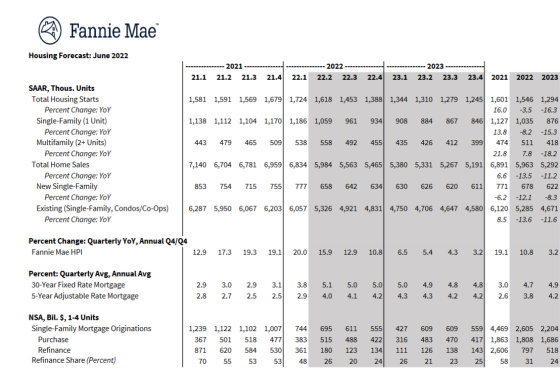
Higher mortgage rates and deteriorating consumer sentiment and economic conditions have led Fannie Mae to significantly curtail its forecast for single-family home starts as well as existing home sales.
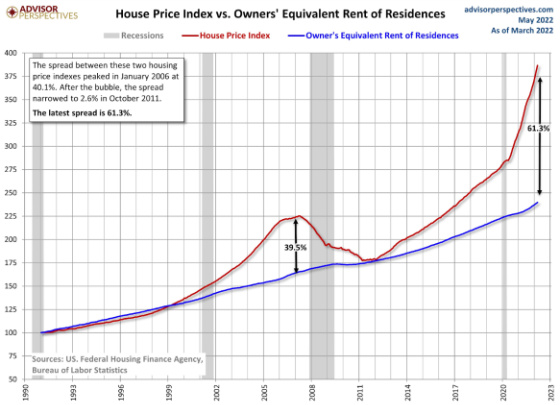
And while we know as apartment owners we are not immune to an economic slowdown or contraction impacting demand, this chart does give us some level of comfort that we are relatively well-positioned from a cost-competitive standpoint as compared to owner-occupied housing.
And if these charts are not a strong indication that the odds of a recession are much greater than President Biden is assigning, then I will leave you with this from a recent blog post from the New York Fed. The authors have a model that forecasts future economic output. The outlook has become much more gloomy than its previous forecast in March. Here is the most relevant excerpt. The bold highlights are mine.
The model’s outlook is considerably more pessimistic than it was in March. It projects inflation to remain elevated in 2022 at 3.8 percent, up a full percentage point relative to March, and to decline only gradually toward 2 percent thereafter (2.5 and 2.1 percent in 2023 and 2024, respectively). This disinflation path is accompanied by a not-so-soft landing: the model predicts modestly negative GDP growth in both 2022 (-0.6 percent versus 0.9 percent in March) and 2023 (-0.5 percent versus 1.2 percent). According to the model, the probability of a soft landing—defined as four-quarter GDP growth staying positive over the next ten quarters—is only about 10 percent. Conversely, the chances of a hard landing—defined to include at least one quarter in the next ten in which four-quarter GDP growth dips below -1 percent, as occurred during the 1990 recession—are about 80 percent.
And while I hope that President Biden is as accurate about the economy as he was about Putin’s intentions and plans for Ukraine, I’m afraid this time he is not correct as hope is not the lens through which dispassionate analysis should be carried out. In the former situation he and his team looked at the intelligence they had very objectively and came to a conclusion that turned out to be spot on. In the latter case with regard to the economy, they are looking through a very different lens of cheerleading and wishful thinking, which I’m afraid will turn out to be an inaccurate assessment of the economy over the next few quarters.
Leave a Reply