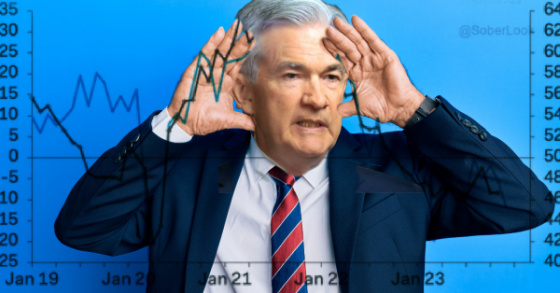
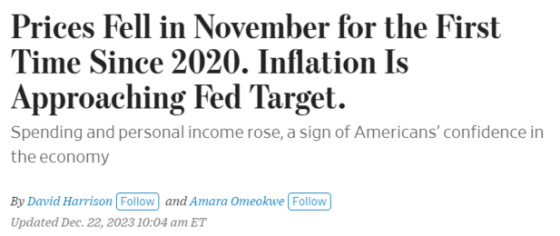
Perhaps Powell’s pivot was highly influenced by having access to the Fed’s favorite inflation indicator, the Personal Consumption Expenditure Index (PCE), well ahead of its official release last Friday. As this headline from the Wall Street Journal shows, the index went into negative territory, putting the Fed’s inflation target in sight.
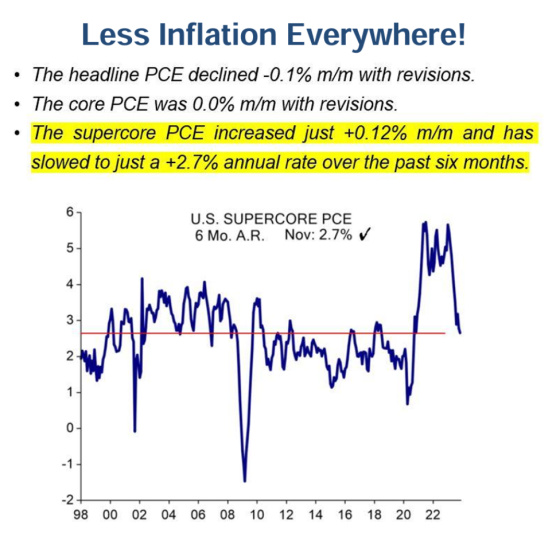
This is Evercore ISI’s take on the significantly improving inflation picture.
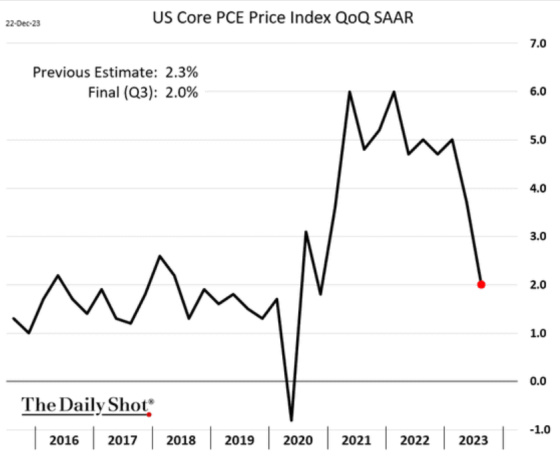
This is the Core PCE that is released quarterly with the GDP report. More corroboration that the Fed’s 2% inflation target is being approached.
The bond market was already sensing that the Fed was done raising rates as early as October, as this chart shows what has happened to 10-year yields since then. They have dropped by over 1%.

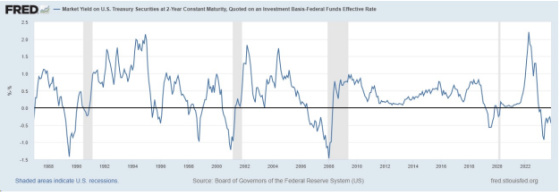
Looking at the 2-year Treasury yield compared to the Federal Funds Rate can be a good leading indicator in terms of predicting recessions and the Fed cutting rates. This chart shows that when the 2-year yield falls below the Federal Funds Rate, this is a precursor to a recession, and the Fed subsequently cuts rates. Currently, we are in a situation where this inversion is the case, and has been for a while, and it is further corroboration that the Fed will be cutting in 2024.
The next few charts show how recession odds appear to be rising. The Index of Leading Economic Indicators has been dropping for 20 consecutive months, approaching 2008 levels, which was obviously a very painful economic contraction.
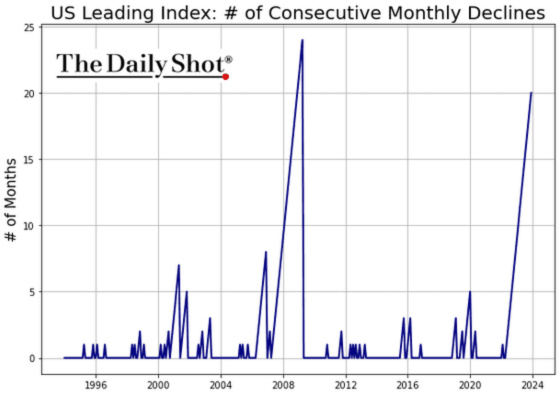
This is another way of analyzing the LEI data, and it, too, is showing that a recession could be heading our way.
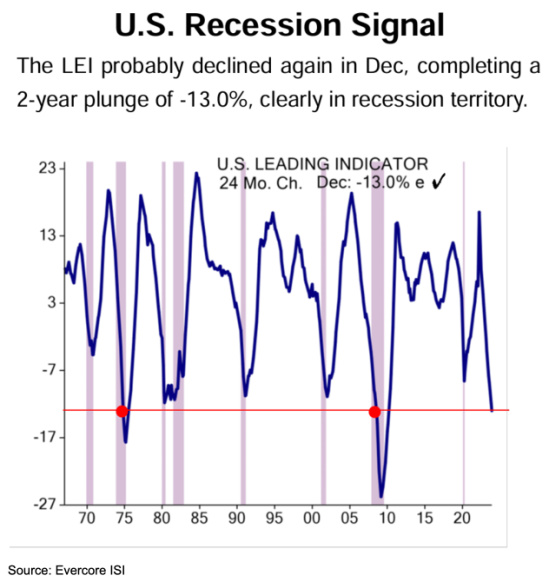
Source: Evercore ISI
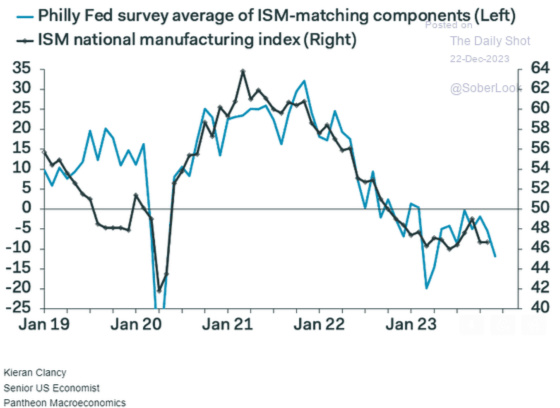
The Philadelphia Fed Manufacturing Index has been in contraction territory for most of the last two years. The sub-index category for new orders is quite weak.

The Philly Fed’s index correlates closely with the national ISM manufacturing index, so we would expect continued weakness nationally related to manufacturing.
Surprisingly, in spite of mortgage rates having come down by approximately 1%, new home sales came in weaker than expected.
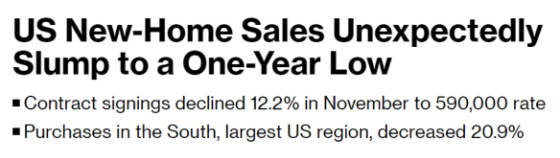
In spite of the drop, homebuilder stocks have been on a tear as mortgage rates have dropped. The market clearly expects a rebound in new home sales in the months ahead.

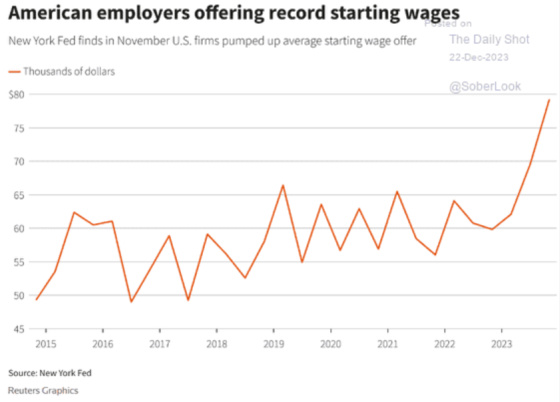
If one believes in the Phillips Curve, which hypothesizes that as unemployment drops, wages typically rise, and inflation increases, then we should be quite surprised by the reduction in inflation, given how wage growth has been quite strong. One can see from Evercore ISI how wages are growing at a very rapid clip.
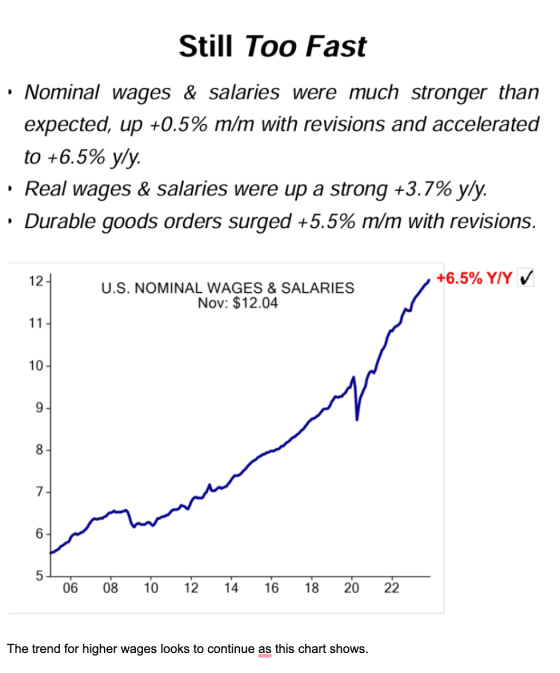
The trend for higher wages looks to continue, as this chart shows.
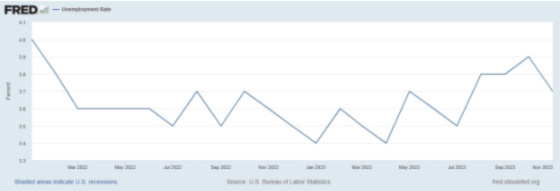
Unemployment is still low at 3.7%, although it’s up a bit from the post-Covid trough of 3.4%. Thus far, despite a very strong labor market and healthy wage growth, we have still seen inflation fall quite significantly. Of course, the absolute level of most goods and services is quite a bit higher than they were pre-Covid, but the rate of growth has slowed down quite substantially.
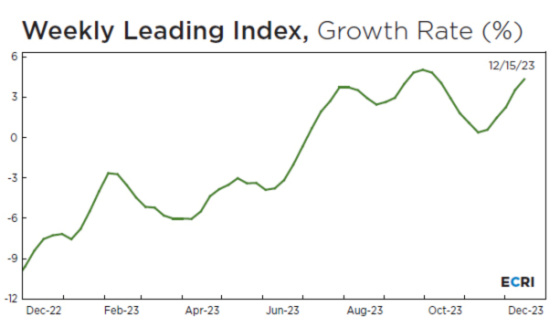
The Economic Cycle Research Institute (ECRI) has a good track record in forecasting changes in the economy and, contrary to the continuous downturn in the LEI, its Weekly Leading Index is back in growth territory and close to the highest level over the last 12 months.
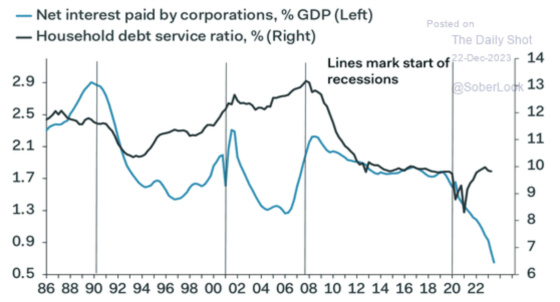
One of the bedrocks of the economy has been how many consumers and corporations took advantage of much lower long-term rates and locked these in for long periods of time. This has cushioned material parts of the economy from higher rates and has helped the economy continue to expand.
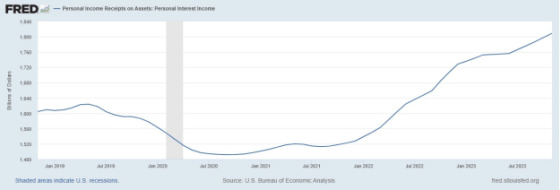
As risk-free rates have increased significantly over the last 18 months, personal interest income has followed suit, adding to some economic tailwinds. I am a strong believer that the Fed’s raising rates are always anti-inflationary because of the interest income channel. As it starts to cut rates, it will be interesting to see if inflation continues its downward march.
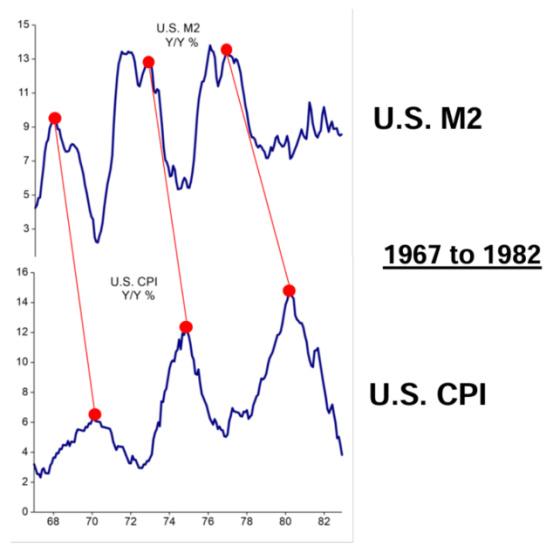
This is one of the most important charts to consider. Will inflation, which has been following the trajectory of the 1970s, which was more of a monetary and demographic (huge numbers of people entering the labor force who were not yet very productive) phenomenon, re-accelerate like it did in the 1970s into the early 1980s, or is today’s inflation transitory due to Covid disruptions?
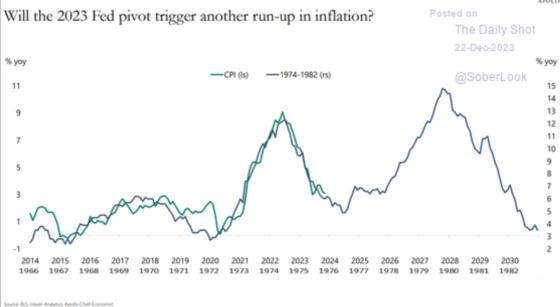
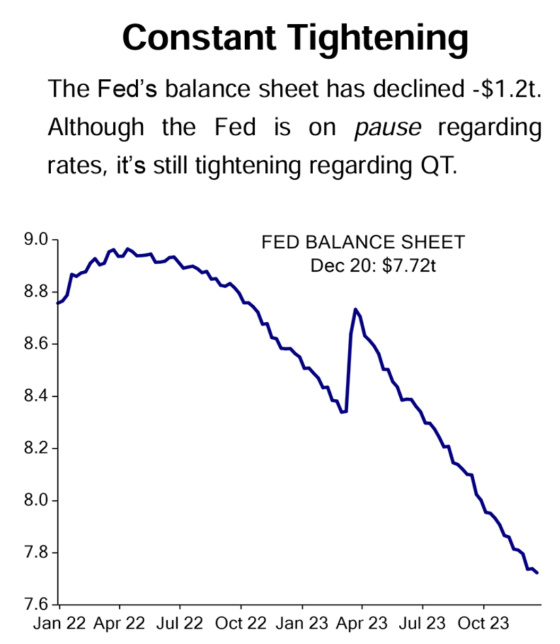
Evercore ISI believes this cycle is not the same because the Fed is dramatically cutting its balance sheet, unlike what was happening in the 1970s and early 1980s.
I think the answer is somewhere in between. I don’t think we are going to face a significant upturn in inflation like we experienced in the 1970s and early 1980s. On the other hand, as I pointed out last week, I think we’re contending with some structural challenges that will probably make the Fed’s target of 2.0% serve more as a floor rather than a ceiling.
It will be interesting to hear what Powell has to say after the next Fed meetings conclude on January 31, 2024. What will he have had peek-a-boo access to prior to that meeting?
Leave a Reply