
One of the things I’m constantly reminded of from playing tennis is the power of consistency. If you can play each facet of the game reasonably well, you don’t have any glaring weaknesses, and you have the anticipatory skills and speed to have effective court coverage, then you can often beat a more skilled, harder-hitting opponent but who is also more erratic. After all, the best players only win 55% of the points, so just being a little bit better for a long period of time compounds favorably to put the odds very much in the favor of the more consistent player who makes fewer mistakes and has fewer errors forced on him or her.
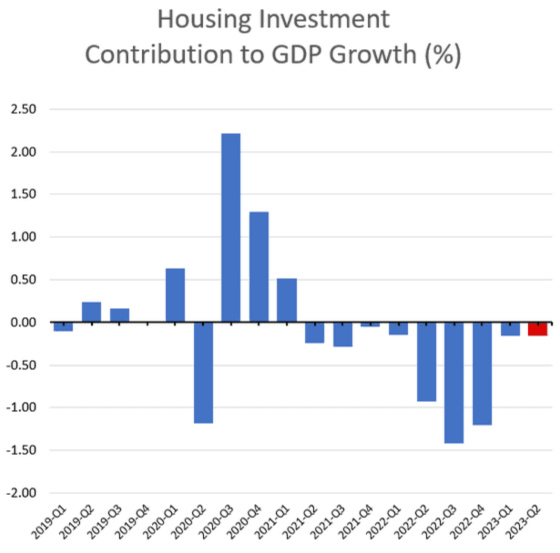
The preliminary GDP report came out last week, and from this chart, it depicts somewhat of a Goldilocks economy. Only a couple of areas are negative (net exports and housing), and they are only slightly so. And while the growth rates of the positive categories are less than in other quarters, they are still growing and not being brought down materially by the weaker sectors. This is a great depiction of an effective tennis player. Consistent serve, forehand, return of serve, court coverage, and perhaps a slightly weaker backhand and volley. But overall very effective and durable.

One can see how housing is contracting less than it has and may become a source of growth again as soon as next quarter.
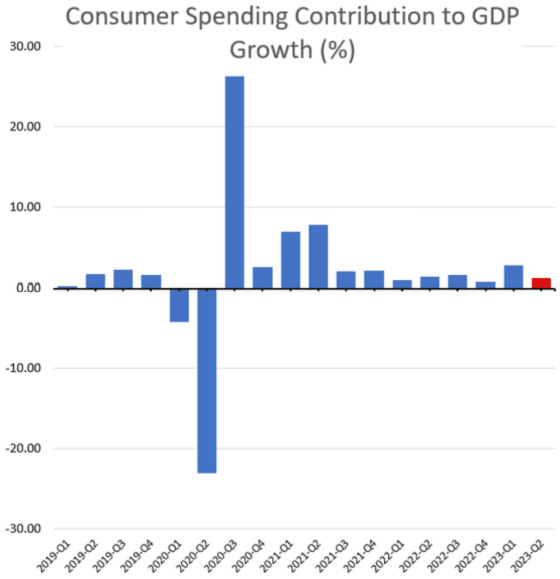
Consumer spending is the area to pay close attention to, given that it makes up approximately 68% of U.S. economic activity. One can see from this chart that it has been slow and steady growth for many quarters now. The question is whether it’s on the verge of going negative as much higher interest rates and tighter monetary policy start to take hold along with the resumption of student loan payments which is estimated to take $100 billion out of the economy annually.
The shift from goods to services continues, although more adjustments are required to get back to the pre-pandemic trend lines, especially for goods. This is another risk to consumer spending down the road. Goods have much further to fall, while services do not have much to grow.

The stronger-than-expected GDP report sent the Citi US Economic Surprise Index to its highest level over the past two years.
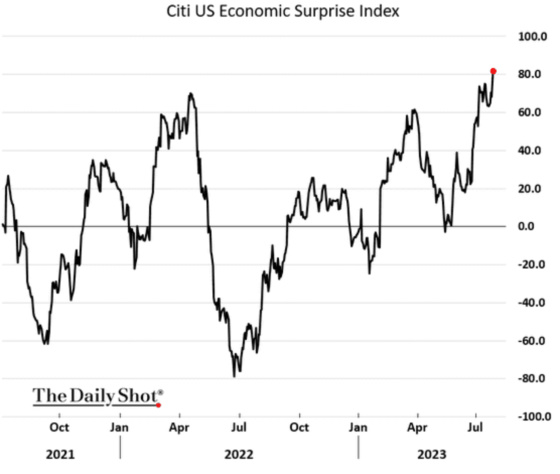
Presumably, this index can’t get much higher, so expectations may be getting too elevated, setting the stage for a rally in bonds and interest rates coming down. After the GDP report, the 10-year Treasury yield breached 4.00% again but has come down below that as of this writing. So far, it looks like the previous high of 4.25% reached on October 24, 2022, is still holding, with additional challenges peaking at 4.22% on November 7, 2022, 4.08% on March 2, 2023, and 4.06% on July 7, 2023. The closing on July 27 was 4.01%. The trend so far is for slightly lower highs which is an encouraging sign that 10-year rates may have peaked.

And while the Fed is clearly not ready to claim victory on the inflation front as it raised short-term rates yet again last week, the price indicators from the GDP report are clearly moving in the right direction. One of the Fed’s favorite inflation indicators is the Core Personal Consumption Expenditures index which measures consumer inflation excluding food and energy. And while still higher than the Fed’s 2% target, it is moving in the right direction and is now below 4% after exceeding it for eight consecutive quarters.

The overall price deflator is much closer to the Fed’s 2% goal as it dropped significantly and is now approaching 2%.

Overall the GDP report was not too hot and not too cold, with good news on the inflation front. All eyes should be on the consumer as this sector has shown remarkably consistent growth that has been modest but not too strong to be overheated and primed for a sharp fall. On the other hand, it won’t take much to move it into negative territory as the growth in goods purchases is poised to continue its slow down or starts to contract, and higher rates and the resumption of student loan payments take a bite out of services spending.
Leave a Reply