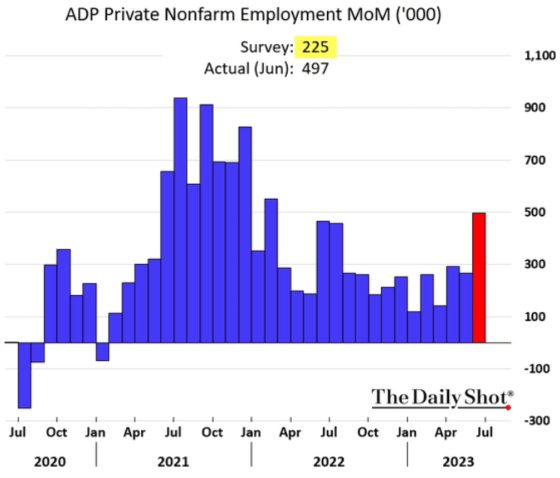
Last week’s ADP payroll report really rocked the bond and stock markets. It was further support for the Fed to remain tighter for longer. This chart shows how strong private employment growth was.
On the other hand, the correlation between the ADP report and the official Establishment Survey from the Bureau of Labor Statistics is virtually non-existent when plotted each month, as this scatterplot shows.
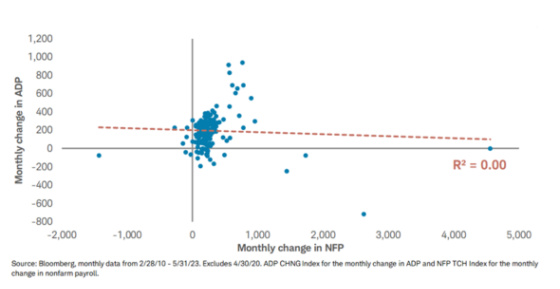
Source: @KathyJones
There is a stronger directional correlation over a longer period of time, however.

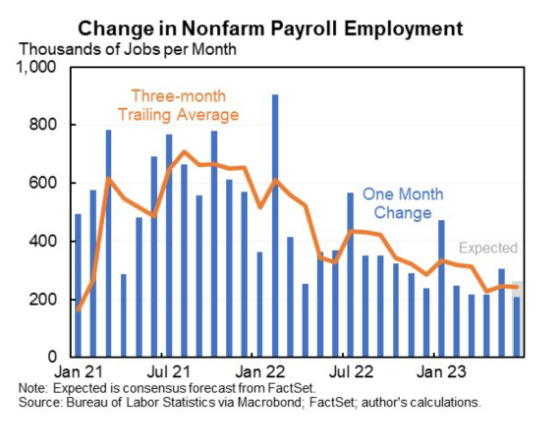
One can see the big spike in the ADP number. So the question is, what would the Establishment Survey show, given its lack of correlation on a monthly basis? The Establishment Survey was released one day after the ADP report, and one can see that this number came in a lot lower than the ADP number and shows a steady slowing of the job market, although probably still hotter than the Fed would like it to be.
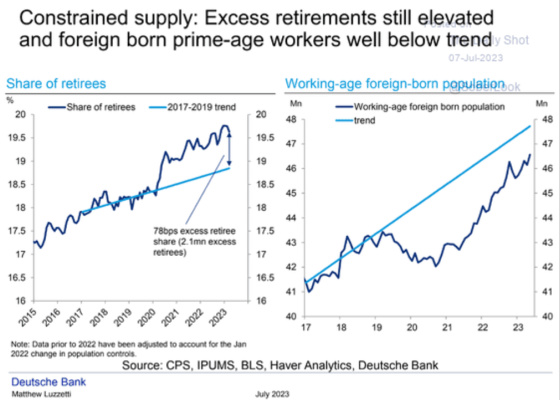
Wage growth came in at a robust 4.4% which is probably aided by labor supply challenges due to less immigration and more retirees. The U.S. economy will need to either have more immigrants enter the workforce and/or have more people come out of retirement to create more labor supply.
The unemployment rate is at 3.6%, so there doesn’t appear to be a lot of slack in the system.
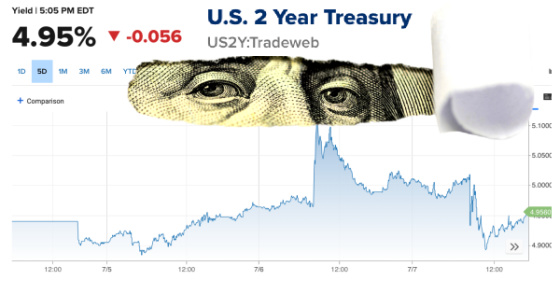
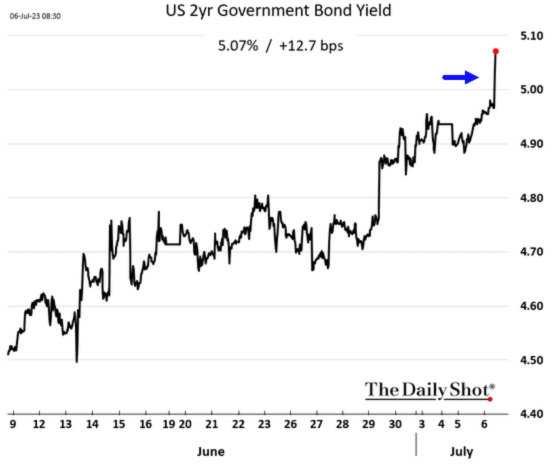
After the release of the ADP report, the 2-year Treasury yield jumped, as this chart shows.
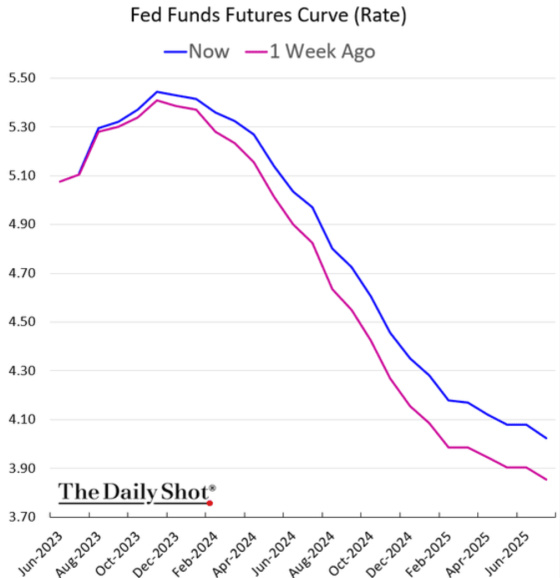
The Federal Funds Futures curve also showed the Fed keeping rates higher for longer.
And yet, after the release of the Establishment Survey, 2-year yields dropped quite a bit, such that it almost erased all of the gains from the ADP bump up in yields.

With that being said, 2-year yields have risen quite a bit since hitting their most recent low of 3.73% in May.

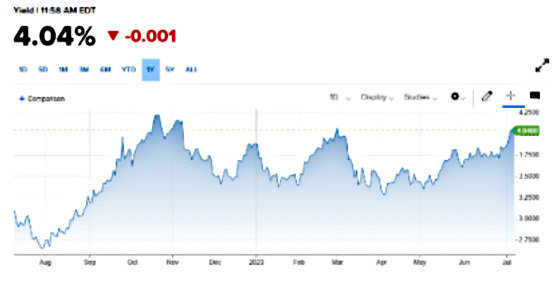
The longer end of the curve has also moved up since the 10-year Treasury yield hit a May low of 3.29%, although not by as much as the 2-year. This suggests that investors see more robust growth in the future….
…while still not being too worried about inflation as forward inflation indicators such as the 5-year breakeven inflation rate have continued to drop.
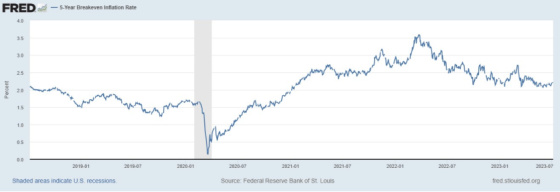
In addition, the outlook for inflation over the next five years, which is priced in five years from now (confusing, I know), has remained remarkably stable, even during Covid.

We’re now possibly at an inflection point in which we may have reached a double top in yields on the 2-year Treasury. It hit a peak on March 7 of 5.085% and closed at 5.066%, while on last Thursday, it hit a peak of 5.12% and closed at 5.006%. As someone hoping for lower rates, I would have liked for the yield to have stayed under 5.085%, but it didn’t. At least it closed materially below that level and dropped quite a bit after peaking on that day and further after the release of the employment report.
In addition, hedgers, which are considered the “smart money,” have been increasingly positioned for rates to drop. They have been consistently wrong as rates have gone up, but on the other side of the trade are typically speculators, so it appears that if economic news is worse than expected. Inflation comes in cooler than projected; then, we could be set up for a big rally in bonds, leading to lower rates.
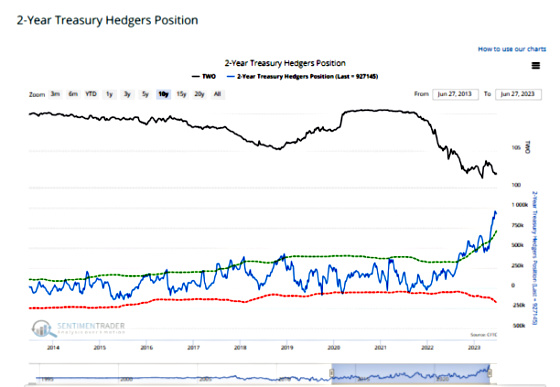
Source: www.sentimentrader.com
The following chart shows Citigroup’s Economic Surprise Index. It is currently at a very high level which reflects how a large percentage of economic reports have come in better than expected.

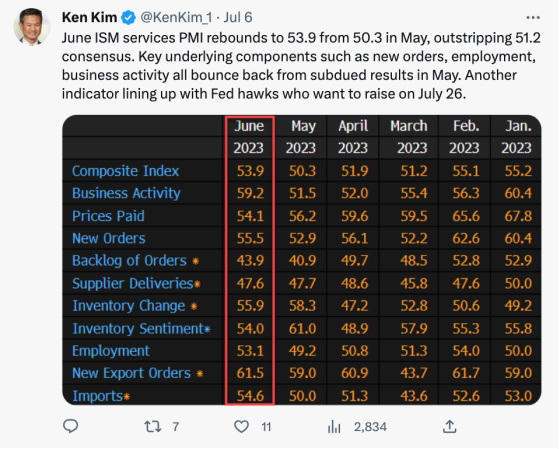
This is an example of an economic report coming in better than expected.

And here are the details of the report showing across-the-board strength.
The Economic Surprise Index is also at a level where it has peaked, economic expectations become too optimistic, and future reports disappoint, and ultimately, this brings the index down to negative territory, with bond yields typically following. The Fed’s own indicators of contributors to financial conditions and whether they are headwinds or tailwinds for future GDP growth are showing more headwinds.

With the potential for yields having hit a double top, massive positioning by hedgers for rates to drop, and economic expectations perhaps being too elevated,
I will be paying very close attention to the 2-year Treasury yield to see if a turning point may finally be at hand, although I’m not holding my breath.
More immigration to lower inflation? While I understand the need for cheaper labor I also see that more people drive up the cost of everything. Shelter cost especially. This works well if you’re in the shelter game but not so well for others. Dare I say we need some socialist policies? Build homes & apartments purely for the need of sheltering cost to stabilize cost or lord forbid even come down rather than purely for profit.
I live in Austin, we’ve had lots of immigrants come from both outside the country and from within (this is a joke about how we refer to Californians). Importing people has made local inflation unbearable. Our shelter cost have skyrocketed to the point it’s hard for even those making a good living to keep up. Do we need more people (immigrants) or we need some deportations (send the Californians back)? Personally I’ve enjoyed the change in political views but it’s at a very high cost. Yes we’ve all made great money (I’ve been in real estate for 30 years) but now we have to look at our children and explain how home ownership is very quickly slipping away and/or being put off till a much older age. “Sorry kids, but hey we enjoyed ourselves”.
The thought of importing more people isn’t working. Importing cheap labor to stabilize labor cost while not figuring out where they will live simply doesn’t work.
Texas is a great display of greed destroying the population. Over crowded streets but the number 2 economy and fastest growing economy for years. Skyrocketing cost of living but the 35th rated schools out of 52 states. This system is broken and needs a remodel before requesting more people to add to the current problems.