
International travel calls so this blog will be on the shorter side. It is fairly well known from research and the school of hard knocks that we are our own worst enemies when it comes to investing. Our emotions, particularly fear and greed, often lead us to buy towards the top and sell when it is closer to a bottom. Most of us don’t feel comfortable taking action outside of the consensus. This makes us susceptible to following the crowd off the cliff at peaks and selling when we should be buying. Is there evidence of this in terms of investor returns? Yes, there is.
Morningstar does research to quantify the “behavioral discount” that investors suffer from due to their psychological pitfalls. They analyze the buy and sell decisions of individual mutual fund investors and compare this to the average return different types of mutual funds generate as well as buying and holding. The following chart breaks down 10-year returns from 2007 through 2016, the latest data analyzed by Morningstar.
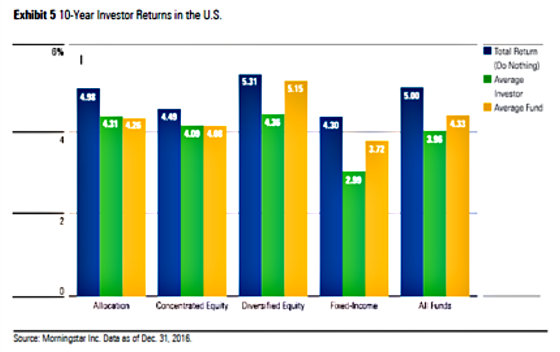
According to Morningstar, the “Do Nothing” portfolio in the United States did quite well. This is what they had to say:
The Do Nothing Portfolio uses fund total returns that are asset-weighted using assets at the beginning of the time period. Essentially, it tells you what would have happened if investors had left their portfolios untouched. This allows us to isolate the changes investors made during the time period in question by comparing the typical investor return (as measured by investor returns that are asset-weighted using an average for the entire time period in question) with the Do Nothing Portfolio.
Performance for this measurement was mixed around the globe, but in the U.S. it performed surprisingly well. In the U.S., the portfolio weighted with beginning-of-the-period assets produced better results than either investor returns or a straight average of returns in each asset class. For example, the typical diversified equity fund investor would have had a return of 5.31%, topping the 5.15% average fund return and the 4.36% average investor return.
For U.S. bond funds, the Do Nothing return was 4.30% compared with 2.99% for the average investor return and 3.72% for the average fund return.
For allocation funds, the Do Nothing Portfolio and investor returns were nearly identical and both were ahead of the average fund. The reason, as stated above, is that target-date funds are a fast-growing segment of the allocation group.
Not only did investors have a behavioral gap as measured by their average returns versus the average fund, but so did mutual fund managers relative to the Do Nothing portfolio. The cumulative return differential over 10 years for All Funds was approximately 10%. Interestingly, the widest gap was in the Fixed Income category which generated a cumulative gap of approximately 13.5%. At low rates, changes in interest rates can have a more magnified impact on bond values, especially if the duration is on the longer end. Perhaps investors would get spooked as rates rise and get out of the funds before capturing the benefits of a rate rally and then move into bond funds when rates are towards the bottom because they are fearful of the weak economic news impacting their more risky portfolios. It’s complete speculation on my part, but that is my working hypothesis at the moment.
Ironically Morningstar may have some culpability regarding the behavioral gap as a recent Wall Street Journal article pointed out. The money chart which I found incredibly fascinating and enlightening shows how fund manager performance gravitates to about average over 10 years.
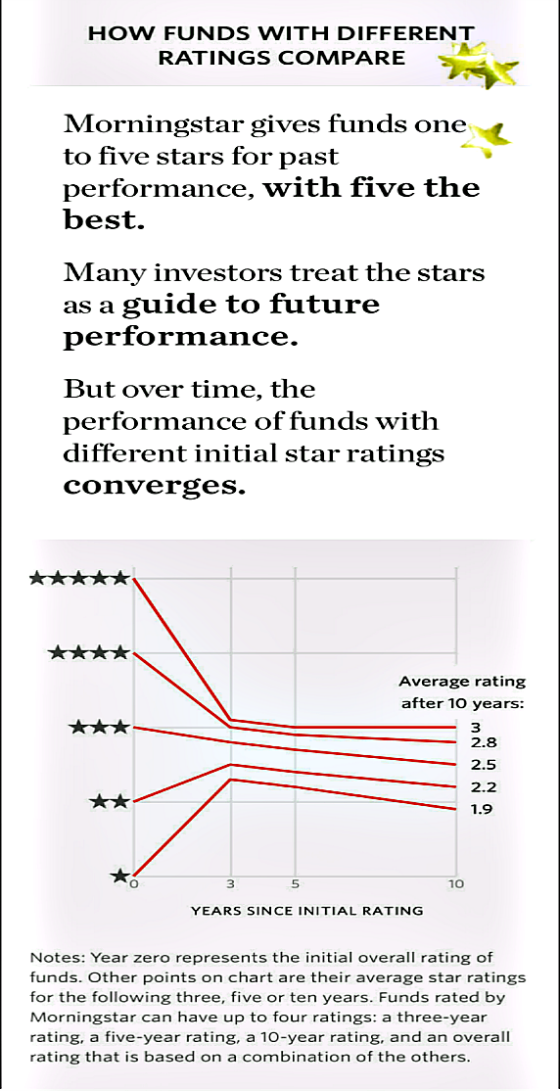
On average, after 10 years, the highest rated five-star funds end up at three stars while one-star funds improve somewhat but still underperform at 1.9 stars. There is a true regression to the mean as the average fund looks to have an average of around the midpoint of 2.5. This is of course what you would expect. Five-star funds still end up better than the 2.5-star midpoint but they clearly go backward. Strong performance tends to get more attention which leads to more capital coming into the five-star funds which usually makes it more difficult to outperform.
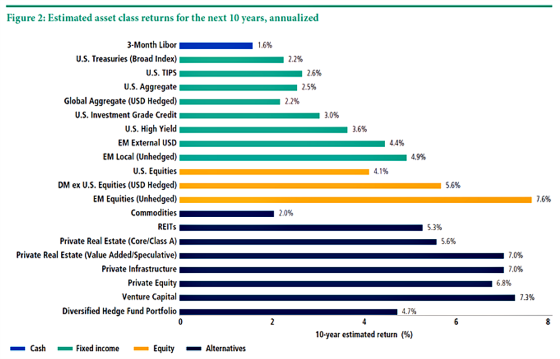
The following table from PIMCO shows their forecast for annual 10-year returns for various asset classes. One can see they project very modest returns. The last 10 years were fairly modest too as the Morningstar data shows. The behavioral gap was not that large because the returns were not very high. I would expect this to be the case over the next 10 years.
Mind the Gap – Easier Said Than Done
Try to do your best to hang in there for the long run and keep your wits about you when times are very good and when it feels like the world is coming to an end. Easier said than done, but try to mind the gap.
Over to You:
How are you at hanging in for the long run?
Leave a Reply