
Now, I go down to Speaker’s Corner, I’m thunderstruck
They got free speech tourists, police in trucks
Two men say they’re Jesus, one of them must be wrong
Industrial Disease by Dire Straits
Interest rates came down quite a bit and then shot up after the non-farm payroll report was released on Friday, showing far greater job creation than expected. Here is a five-day chart of the 10-year Treasury yield. It started the week close to 4.50% and went down to 4.28%, only to go back up to 4.42% as of this writing.

The report showed that 272,000 jobs were created. Here is what the forecasts were before the release. All of the estimates fell way short.
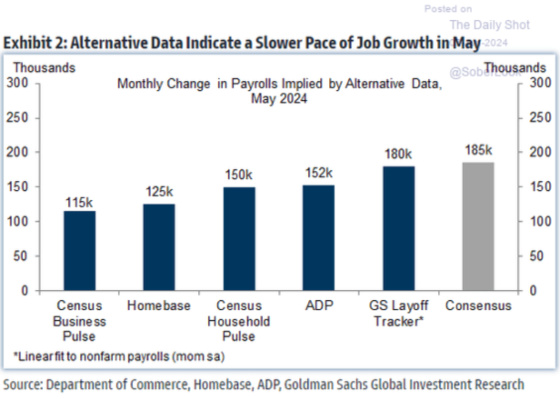
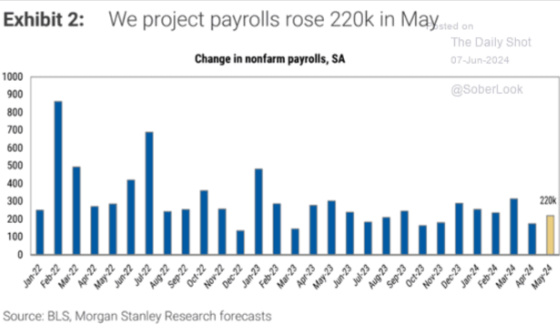
Morgan Stanley was the outlier in projecting job growth in excess of 200,000 (220,000).
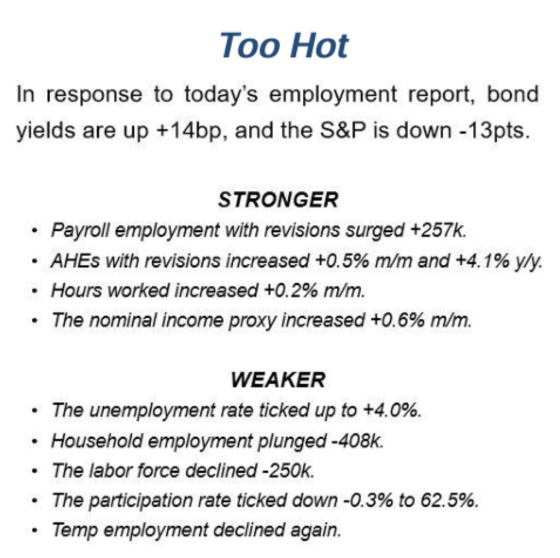
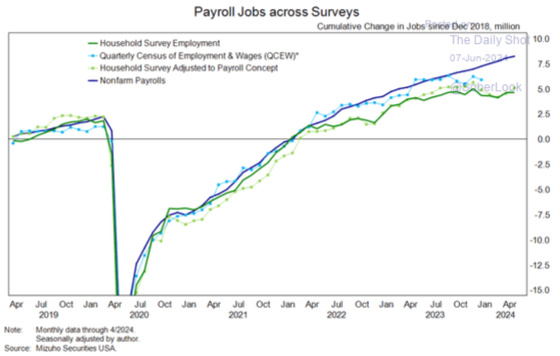
Establishment Survey vs. Household Survey
I think Ed Hyman of Evercore did a good job summarizing the crazy dichotomy between the Establishment Survey, which generates the job growth number, and the Household Survey, which produces the unemployment rate.
We had strong job growth and yet the unemployment rate went up at the same time as labor force participation went down? How can this happen?
This is how.
The quandary is that the Household Survey is showing job losses and labor force participation going backward, which is how the unemployment rate went up.
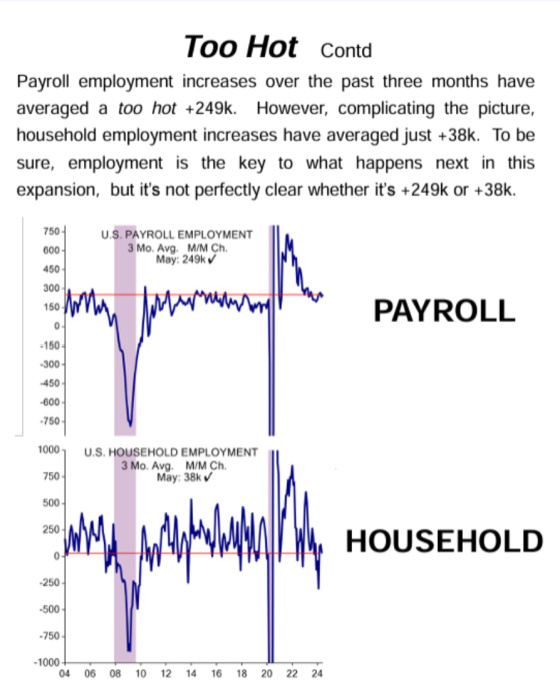
The obvious question is, which one is right?
I may be biased because I’m generally hoping for lower interest rates, but I think there is some evidence that the Household Survey may be more accurate than the Establishment Survey. This chart shows the continuous and growing gap between the two surveys.
As this headline from a Bloomberg article shows, the jobs number is expected to be significantly revised downwards based on more complete data, leading the Bureau of Labor Statistics to make its final revisions. This is an arrow in the quiver of the proponents of the Household Survey, who argue that it is more accurate.
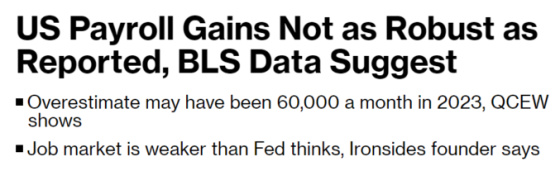
And this is what the article says about how a job market that is weaker than the Fed thinks has made its job more challenging in terms of optimizing monetary policy and short-term rates.
Data published Wednesday, June 5th by the Bureau of Labor Statistics suggest payrolls might have grown about 60,000 less per month on average last year than the roughly 250,000 run rate derived from the agency’s monthly employment report. The new figures from the Quarterly Census of Employment and Wages cover more than 95% of US jobs and are eventually used in annual revisions to the monthly data.
The QCEW release, as it’s known, adds to the uncertainty surrounding the state of the labor market as the US central bank deliberates over when to begin cutting interest rates. While some indicators — such as monthly payrolls and weekly unemployment insurance claims — suggest the market remains robust, others — such as rising unemployment and a decline in job openings — point to cracks developing.
“There’s a pretty good chance that the establishment survey has been really overstating the condition of the labor market,”
Barry Knapp, founder of Ironsides Macroeconomics, said of the monthly payroll numbers.
“The job market is weaker than the Fed thinks.”
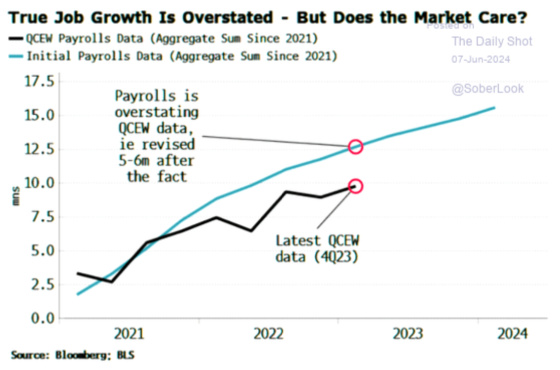
This chart shows the QCEW trends and how this is also a meaningful gap between the two, commensurate with the Household Survey.
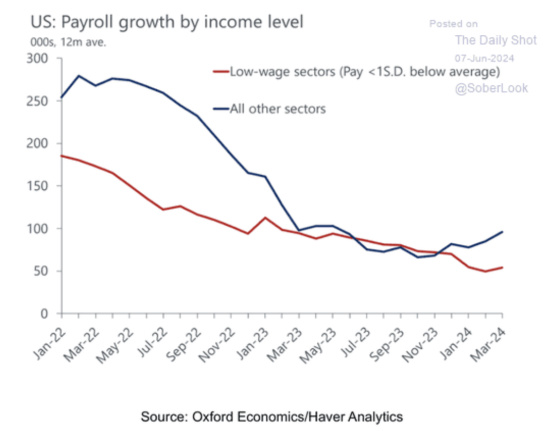
Here is another indicator suggesting a labor market slowdown ahead.

One can also see that job growth is slowing for lower-income workers and picking up a bit for non-low-wage sectors.
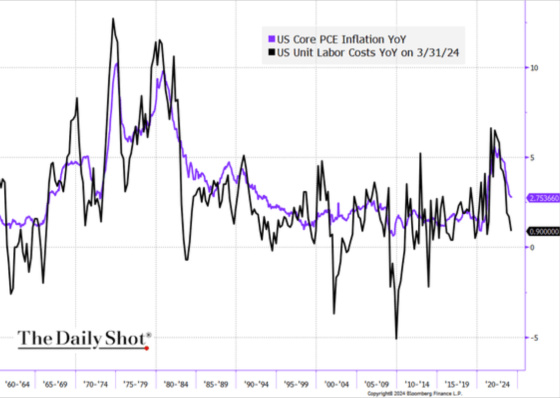
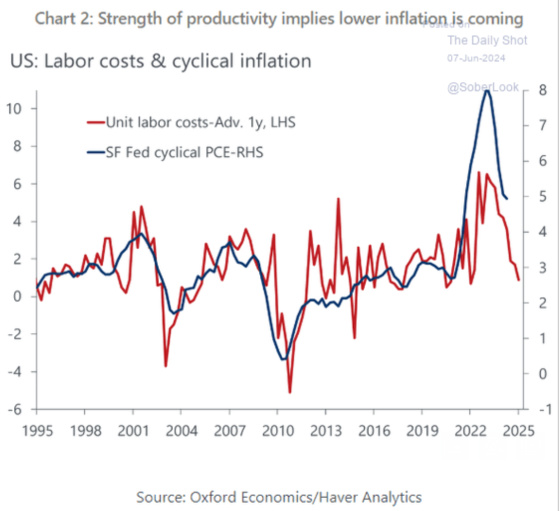
Wage growth is slowing, and productivity is growing, which should help lessen inflationary pressures.
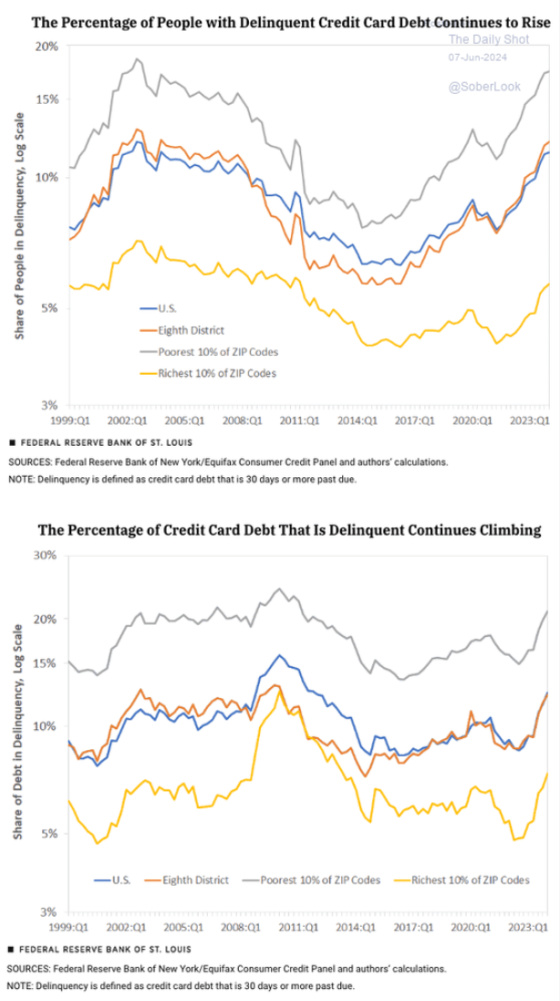
With credit card delinquency growing fairly significantly, this suggests that more financial pressure is weighing on consumers, which could impact spending in the year ahead and create more disinflationary pressures.
As the line from the Dire Straits song cited at the beginning of this says,
“Two men say they’re Jesus; one of them must be wrong.”
The same is true for the two job surveys. If I had to bet, I would say the Establishment Survey is wrong, but only time will tell.
Leave a Reply