I’ve been wrestling with the theory that we have had a regime change from the credit dislocation cycles that have led to emergency-type measures from the Fed via balance sheet expansion and near 0% interest rates to one that has inflation as much more of a central concern due to powerful fiscal expansionary tendencies and other factors such as onshoring of manufacturing, green energy transition, aging labor force, etc. The former regime I have been calling the Long Emergency.
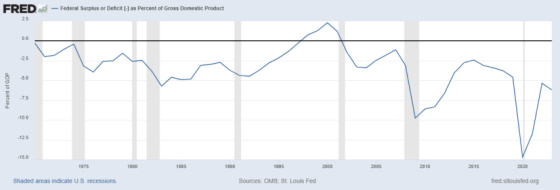
I think the key variable that led to generating the escape velocity to get out of the Long Emergency was the federal deficit. From the graph below one can see that a federal budget deficit is the norm. Only for a very short period of time since 1970 has the budget been in surplus. This was during the Clinton administration when there was talk of a shortage of Treasury securities on the horizon because so much of the debt would have been repaid. For those who understood how a public sector surplus meant a private sector deficit knew that this was only going to lead to an economic contraction because eventually the private sector would have to stop borrowing and spending and begin saving and cutting back spending. And when this took place the federal government would have to step in via deficit spending to make up the shortfall. This is precisely what happened when the recession of 2000-1 ensued.
The deficit tends to be approximately 2.5% of GDP during economic expansions and 5.0% during recessions. This all changed after the Great Financial Crisis of 2007-9 when the deficit exploded to 10% but then returned to 2.5% in 2015. Since then, however, with the advent of Covid, the deficit has gotten as high as 15% of GDP (the highest since World War II) and as low as 5.3% of GDP in 2022 and is now expanding again in spite of not being in a recession. The size of the deficit is unprecedented for an economy not in a recession.
If we are in a regime change then what does this mean for interest rates?
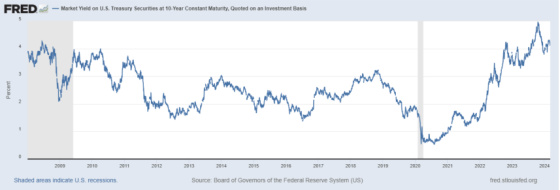
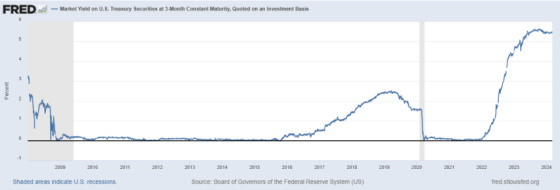
This is the 10-year Treasury yield between 2008 and today. Prior to the current Fed tightening cycle that started in April 2022, the range had a high of 4.27% in June 2008 to a low of 0.52% in August 2020. During this time the yield averaged 2.37%. Today it is approximately 4.08% which is on the high end of the nearly 16-year range. Prior to Covid (2008-2020) median CPI averaged 2.22%. If we eliminate the Covid noise then real 10-year yields were barely positive at 0.15% (2.37% minus 2.22%).
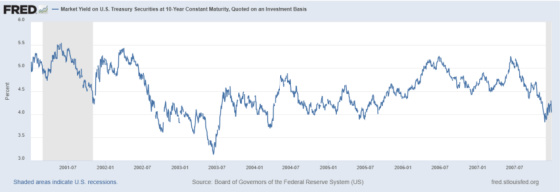
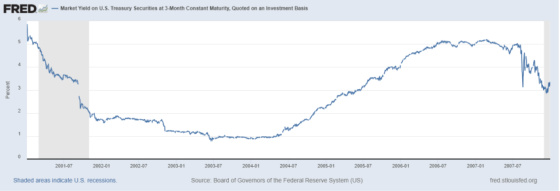
If we are out of the Long Emergency, then perhaps it makes sense to look at what yields were during another time when such an emergency wasn’t in place. I decided to use the 2001 through 2007 time frame because I think the range of yields is more in line with where I think they could be going forward versus the much higher yields of the 1980s and 1990s.
During these seven years the peak yield was 5.54% and the trough was 3.13% with an average of 4.52%. The median yield was also 4.52%. The median CPI during this time averaged 2.70%. This translates into a much higher real 10-year yield of 1.82% (4.52% minus 2.70%). Thus, this non-Long Emergency era was characterized by very positive real yields versus virtually 0% for the Long Emergency.
Now let’s turn to 3-month Treasury Bill yields as this is more reflective of shorter-term, floating rates versus the 10-year which is more indicative of longer-term fixed rates. Between 2008 and March 2022, just prior to the Fed embarking upon its aggressive tightening campaign the 3-month T-Bill averaged 0.55% which translated into an estimated inflation-adjusted yield of -1.67%. It was a great time to be a floating rate borrower!
If we go back to 2001 through 2008, the 3-month T-Bill yield averaged 2.87% with a peak of 5.87% and a low of 0.81%. When using the average yield of 2.87%, this generated an inflation-adjusted yield of 0.17%. So perhaps it’s reasonable to assume that normalized 3-month T-Bill yields should track inflation.
So now all roads lead to the expected rate of inflation in the years ahead. If we assume that the real 10-year yield will be in the 1.80% range and the 3-month T-Bill yield will track inflation then we can come up with an estimate of both yields once we have an inflation projection.
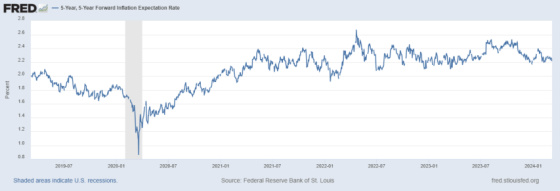
This is the market’s estimate of inflation five years ahead looking forward five years. I know that is hard to wrap your head around but quite simply it’s a forward inflation estimate. It’s been consistently in the 2.0% to 2.50% range since 2021.
Here is another future inflation indicator which also has been in the 2.0% to 2.5% range.
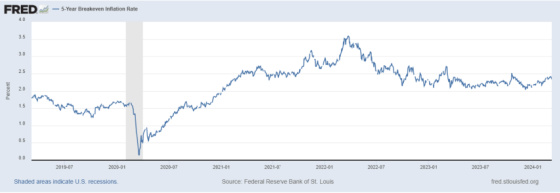
If we peg future inflation in the 2.0% to 2.5% range then this would suggest an equilibrium 10-year Treasury note yield of approximately 3.80% to 4.30% and a 3-month T-Bill yield of 2.0% to 2.5%. Right now the 10-year is in the range whereas the 3-month T-Bill yield is almost 3% higher than the equilibrium range. This makes the market pricing in lower short-term rates over the next few years quite understandable, along with the Fed not pushing back too hard on this set of expectations.
I will end with one wild card that I’m sure is keeping the Fed on edge about lowering rates prematurely. I have been using Median CPI as my proxy for inflation. This index is based on the median inflation reading of all of the indices in the CPI basket without weighting one more highly than any other.
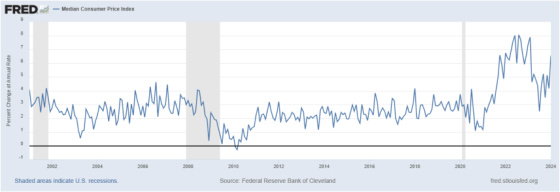
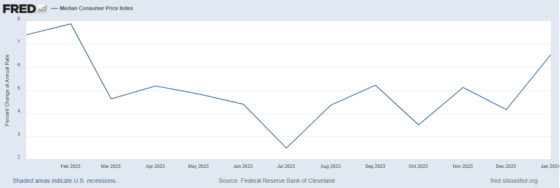
One can see how for a long period of time this too has usually fallen between 2.0% and 2.5%. We can also see the huge spike during Covid and then it coming back down rather precipitously in 2023 to less than 3% in July. If we zoom into the last year, however, we can see that it has been on a march upwards again and has now breached 6%. And while one indicator shouldn’t be the basis of interest rate decisions, this one would definitely give me pause until I see this coming down again quite significantly and staying down.
Leave a Reply