
Last week was pretty important in confirming the trend change in interest rates and solidifying a slowdown in economic activity. Evidence of the economy slowing is reflected in more U.S. firms cutting their earnings guidance versus raising them.

As the above chart shows, healthcare has been a sector that has seen a large number of companies lowering their guidance, although there is still a cohort of firms raising theirs. Commensurate with the sector’s lower guidance is the prospect for greater loan defaults in the future, as this chart shows.

One of the economy’s pockets of strength has been capital spending in the technology sector. If the decision of firms like Google, Microsoft, Meta, and Salesforce is any indication, then the trend for this continuing is not favorable. These companies, along with many others, have laid off thousands of employees. Cost control, disciplined capital spending, and cash flow preservation and growth are now the primary focus of these management teams.

One can see that tech layoffs have really picked up and now have exceeded what took place during the height of Covid.
![]()

And here is the latest announcement from Google.

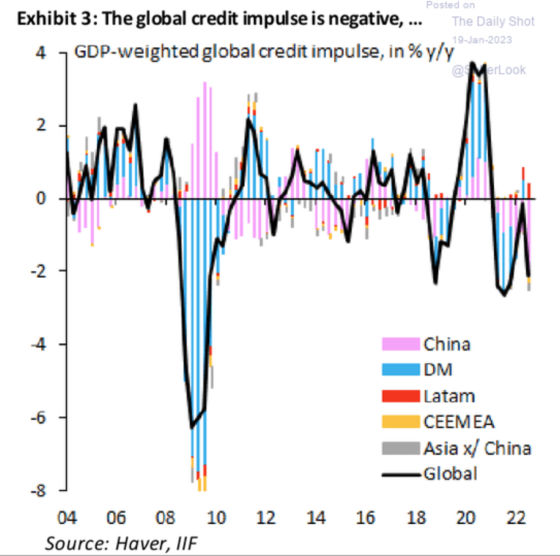
The momentum in global credit creation is extremely weak, as this chart shows, which represents a headwind for economic growth.
Retail sales appear to be softening quite materially as this chart shows how sales have contracted over the last two months.

And while retail sales have remained quite elevated on a nominal basis, the picture changes quite significantly when factoring in inflation.

Although consumers still spend more on services than goods, since Covid, however, the market share of goods has grown quite significantly at the expense of services. Later I will discuss some of the challenges of the labor market in terms of large numbers of people having dropped out of the labor force. This has disproportionately hit the services sector, especially for those businesses that help support the office economy, which has been hit incredibly hard by the massive move of workers doing their jobs remotely.

This slowdown in spending is coming at a time when retail sales represent a large percentage of consumer spending, although still less than its historical highs.

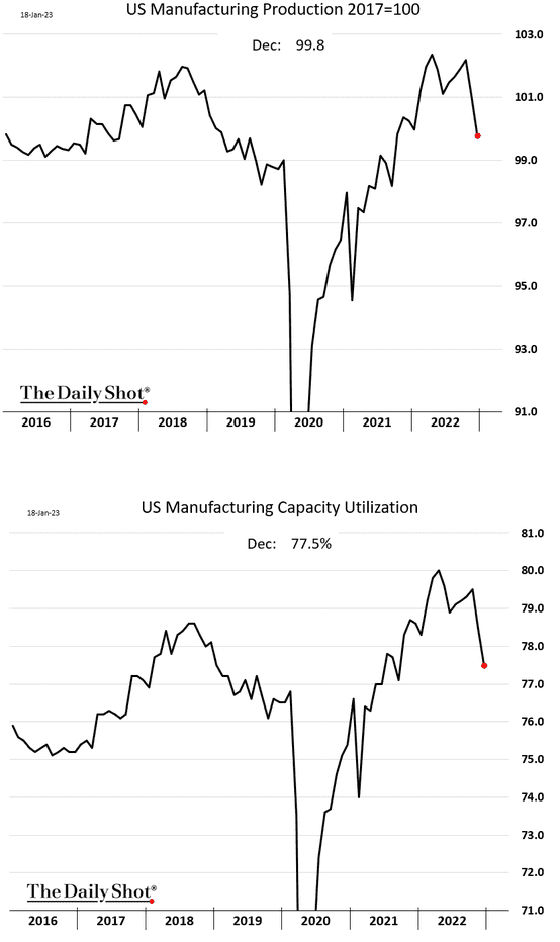
Retail sales is not the only area of the economy experiencing weakness. Industrial production is softening as well.
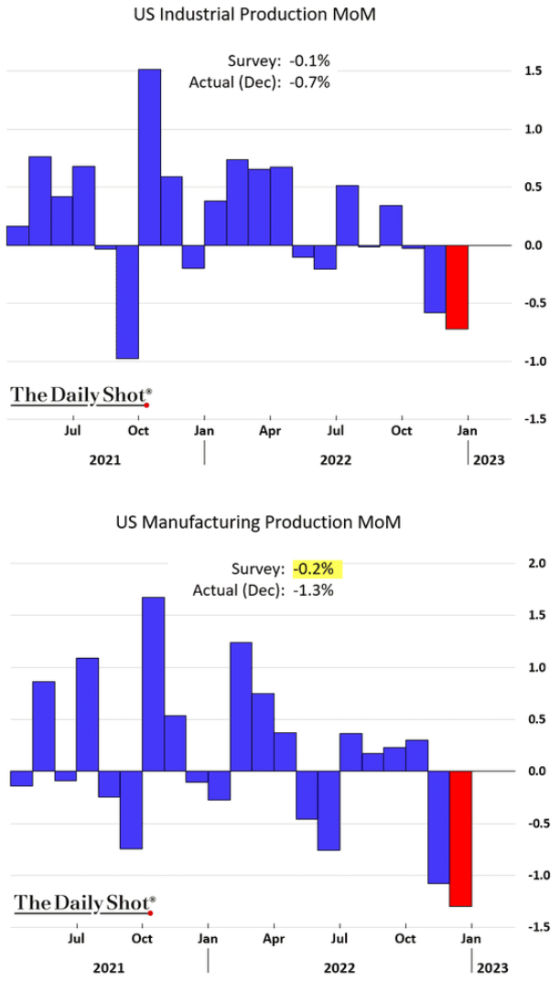
This chart shows how manufacturing output has peaked and is now rolling over.
This chart shows how the pace of deceleration has picked up for manufacturing, excluding autos.

Now that we have some clear evidence of slowing economic output, the next question from a Federal Reserve perspective is what is happening on the inflation-fighting front? From a Producer Price Index (PPI) standpoint, the news is improving here as well.

The much improved CPI trends, along with PPI, have dramatically changed Inflation expectations as compared to six months ago, particularly in the shorter term.

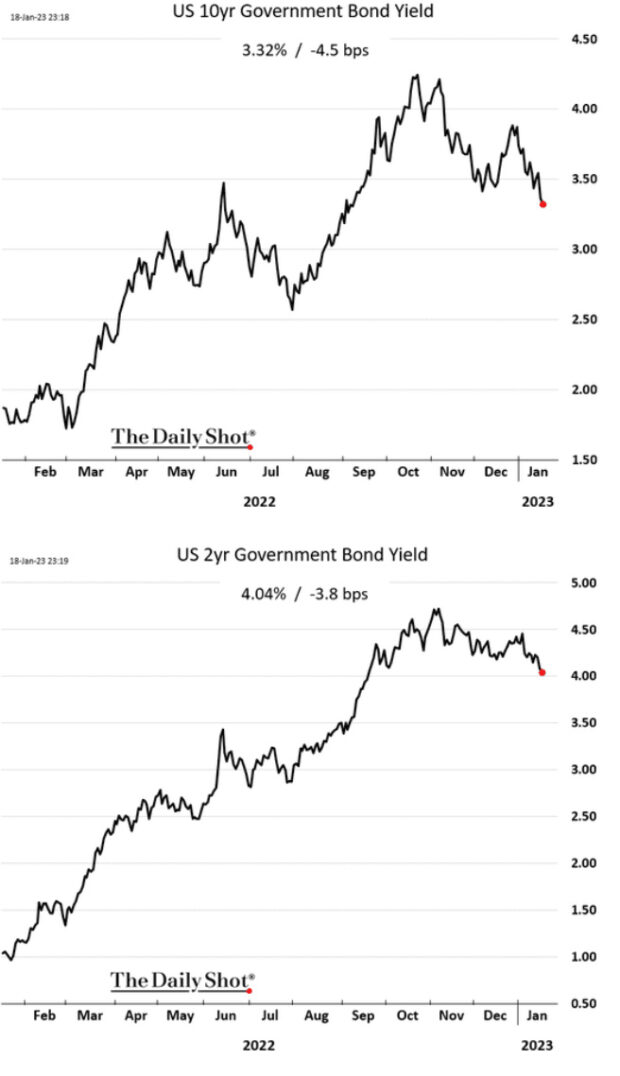
The combination of weaker economic data and substantial progress on the inflation front has led to a material drop in 10-year and 2-year Treasury yields. It does seem like the highs for this cycle have been reached, so the trend should be for yields to continue to drop as the economy weakens and the Fed has to reverse course.
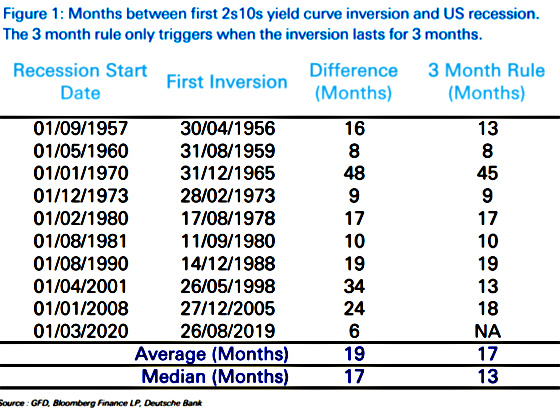
The yield curve has not experienced this level of inversion (3-month yields higher than 10-year yields) in the last 30 years. This suggests that the Fed will have no choice but to start cutting rates.

Historically, recessions start about 17 months after the 2s/10s Treasury curve has inverted for three months. This would put us approximately nine months away from that point.
And yet, despite all of the data showing an economic slowdown (contraction?), the labor market, as measured by unemployment claims, shows great resilience. We could be seeing a bifurcated labor market with strength for lower-wage jobs and weakness at the higher end (tech, finance, real estate, etc.).

According to this researcher, much of the labor force reduction is in the service sector, which may be contributing to more demand versus supply for lower-wage workers.

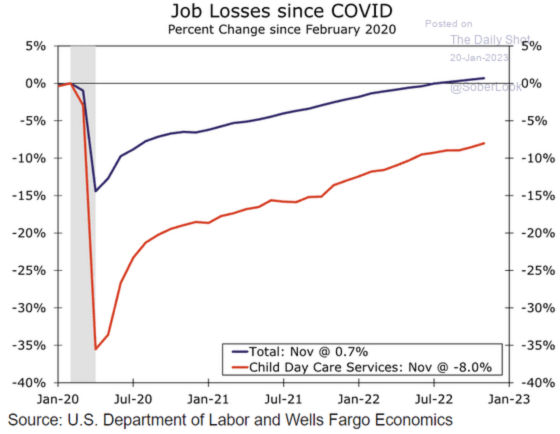
The labor supply issue may be exacerbated by parents not having as many daycare options as they did prior to Covid, which may have led more people to remain out of the labor force to care for their kids.
And if Goldman Sachs’ forecast has validity, then labor shortages exist not only in the services sector but in the manufacturing sector as well. This looks to become even more challenging given the aging labor force and more companies seeking to diversify their supply chains away from China, which should increase the demand for manufacturing workers as onshoring grows in the years ahead.

I have called this post “And Yet” because in spite of economic data, positive trends on the inflation front, and a bond market screaming that the Fed is going to overtighten, the labor market is showing some powerful resilience that may be with us for a while and may require the Fed to keep rates higher to ensure that it pushes the unemployment rate higher to better align labor supply and demand by curtailing demand. I have written about the challenges of following this policy and some of the unintended consequences, but once again, the Fed has now seen inflation come down and the economy softens, and yet, it has still not cracked the labor market. Only time will tell, but the bond market believes the Fed will do just this.
Leave a Reply