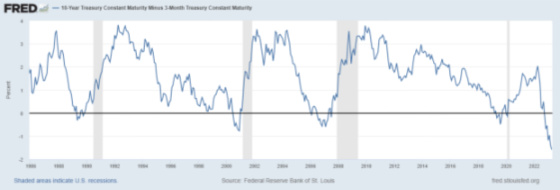
As this chart shows, the yield continues to invert with 3-month Treasury Bill yields substantially higher than 10-year Treasury Note yields.
As I wrote about previously, Fed Chairman Jay Powell discounted traditional yield curve indicators such as the differential between 10s and 3-month T Bills and 10s and 2-year Treasury yields. He found research done by the Fed showing that the Near Term Forward Spread had a much better forecasting record of future economic activity and Fed policy to be quite persuasive. This is the difference between the market’s forecast for the 3-month T Bill yield 18 months from now and the current T Bill yield. When the value is positive, then the market is assigning a higher probability of short-term rates being higher in the future, and when it’s negative, that rates will be lower in the future. Right now, the spread is the most negative it’s been in over 40 years.

The Near Term Forward Spread is being corroborated by the Conference Board’s U.S. Leading Index. It’s clearly in a downtrend. Of its 10 components, seven are negative, two are barely positive, and one is neutral.
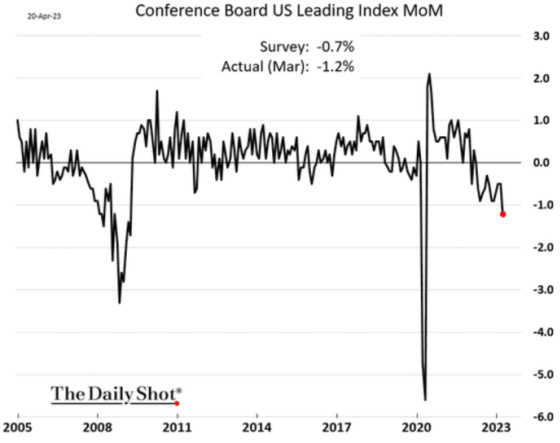
And when looked at over a six-month percentage basis, it is now at a level that has consistently preceded a recession and typically goes lower from here now that downward momentum is firmly in place.

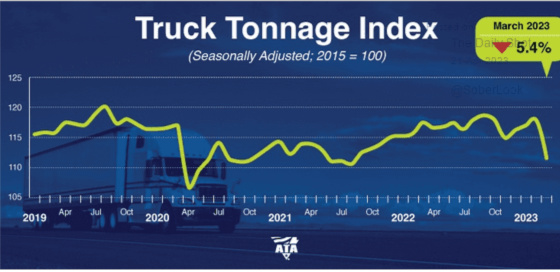
Trucking activity is considered a good barometer of economic activity, and this, too, is in a firm downtrend.
This headline from Bloomberg regarding Tesla conveys concerns that consumers are hesitant to make big-ticket purchases (e.g., cars) given people are contending with inflation, higher borrowing costs, tighter credit standards, and a job market that is showing some cracks. One of the challenges facing consumers and automakers is that the supply shortages of cars as a result of Covid and supply chain issues led to people buying autos and trucks at inflated prices and with correspondingly high loans. This may make it quite challenging to refinance or sell their cars, given they may have negative equity, especially since loan terms have lengthened to close to six years, resulting in taking longer for equity to build up. Investors have not been very friendly towards the auto sector, and this was amplified last week with Ford being down almost 6% and GM down approximately 4%. And add Tesla’s drop of nearly 12%, and it was not a great week for the major U.S. auto manufacturers.
Even the Fed is finally coming around to now forecasting a recession to kick in during the second half of 2023.

Last Friday, Lyft announced a huge reduction of at least 30% of its employees. The company has fallen far behind Uber in terms of efficiency and the services it offers. Lyft’s stock price has dropped 71% over the past year, while Uber’s has slid by only 6%, clearly showing that investors lack confidence in Lyft. The board of directors replaced the CEO, and the new one announced the company’s focus on dramatically improving its cost structure and efficiency, which can only have a hope of being successful by carrying out a drastic employment cut.
Turning to real estate, and in particular, the apartment sector, here are some metrics from Walker & Dunlop, a firm that focuses on arranging financing for apartment owners as well as having a now sizable brokerage arm to facilitate the sale of apartment communities. I hold the firm in very high regard, and one can see how challenging it’s been for WD since the Fed has embarked upon its very aggressive tightening campaign to stamp out inflation.
Q4 non-GAAP EPS of $1.41 misses by $0.23, and revenue of $282.9M (-30.5% Y/Y) misses by $48.56M.
Transaction volume was $11.2B, down 59% on a yearly basis.
Net income stood at $41.5M, down 48% Y/Y.
Adjusted EBITDA was down 16% Y/Y to $92.6M.
Total debt financing volume decreased to $11.2B.
Operating margin stood at 17%, compared to 27% a year ago.
ROE was down to 10% from 23%.
The firm had to finally bite the bullet and begin layoffs after trying to hold on to its teams, expecting market conditions to improve. And with CBRE and JLL already announcing headcount reductions, it’s becoming clear that the real estate industry overall is bracing for a continued slowdown as these firms have a large presence beyond apartments in terms of facilitating transactions.

One of the reasons I didn’t think rates would rise as significantly as they have was because of my belief that when the market rate of interest is substantially higher than the average rate of interest for private borrowing in the economy, then borrowers with maturing loans may be faced with challenges refinancing their debt if they started off with high leverage and didn’t grow their incomes to earn their way out of the old loan to qualify for the new ones. And this will serve to slow the economy as more firms and individuals are focused on solving their problems versus being able to turn their attention to growth. As shown in the WD example, we are seeing this in commercial real estate, as well as in the residential market, as there’s not enough business to support a level of overhead predicated on a much more robust transaction environment. This should lead to more layoffs and either slow or contract economic growth, thereby leading the Fed to lower rates.
So far, the Fed has not budged despite very clear signs of an economic slowdown and its own members forecasting a recession.
To test my theory, I decided to use the 7-year Treasury yield as a proxy for the average maturity of debt in the economy as well as an indication of when current rates can differ materially from the average yield over the previous seven years. By using the seven-year average yield, I’m trying to create a proxy for the average yield of maturing debt to see when the ratio of current yields to the average yield over seven years is high whether it leads to lower rates in the future. Here is the graph.

One can see that this is a pretty good indicator of foreshadowing slower economic growth or a recession and correspondingly lower future rates based on what happened to the economy after this ratio hits a cyclical peak. The ratios peaked as follows:
| Date | Peak Ratio | Basis Point Differential | 7-Year Yield | Trough Rate | Ratio/Basis Points | Date |
| 2/10/00 | 112.5% | 77 | 6.87% | 2.63% | 48.6%/-178 | 6/13/03 |
| 6/12/07 | 118.2% | 80 | 5.21% | 0.91% | 28.1%/-232 | 7/24/12 |
| 10/5/18 | 167.4% | 128 | 3.18% | 0.36% | 17.9%/-165 | 8/4/20 |
| 10/20/22 | 230.8% | 247 | 4.36% | ? | ? | ? |
Each cycle requires a higher ratio and basis point differential to compensate for rates dropping quite significantly during the down cycles. In each of these cycles, the ratio unsurprisingly also represented the peak in rates or very close to it. In three of the four most recent tightening cycles, this indicator has been able to lead the Near Term Forward Spread, as this table shows.
| Peak Ratio Date | 90-Day Moving Avg. NFTS* | #Days Until it Turned Negative* | #Days Until Peak 3-Month T Bill Yield |
| 2/10/00 | 1.14 | 208 | 186 |
| 6/12/07 | -0.42 | -171 | -75 |
| 10/5/18 | 0.85 | 173 | 113 |
| 10/20/22 | 1.49 | 100 | 125** |
*Source: www.neartermforwardspread.com
**The 3-month T Bill yield has been rising consistently and hit a peak on April 21st.
The 7-year Treasury yield as of last Friday was 3.61%, so it looks pretty convincing that it’s probably peaked for this cycle, especially as the Fed seems intent on only one or two more interest rate hikes. As a reference, the 7-year moving average for the 7-year Treasury yield is 2.02%, so if we go back down to the 50% ratio that has been reached in past cycles, we could see 7-year rates go back down to 1%. This can also be corroborated by the four peak-to-trough cycles, with the 7-year yield drop by 3% to 4% in each.
This analysis becomes more powerful the greater the number of loans in place that are floating rate since they reprice to market rates quickly as well as the number of loans maturing. There are enough floating rate loans in the commercial real estate space to create challenges to slow it down as more firms have to play defense and no longer be able to play offense. With regard to commercial real estate maturities, it looks like this is not an insignificant number and will be growing over the years.

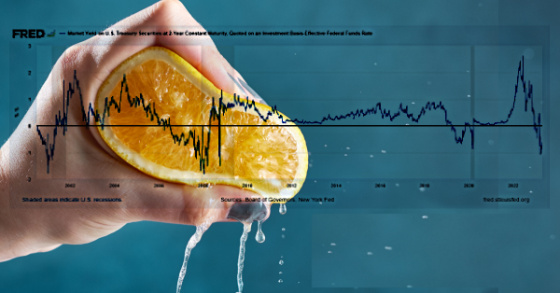
With the curves so inverted, including Powell’s favorite curve indicator, the market is unequivocally telling the Fed enough is enough. And with the Federal Funds Rate significantly higher than the 2-Year Treasury yield, another indicator of how tight monetary policy is now, history would suggest that the Fed will be pausing soon and need to start cutting rates in the second half of 2023 or early 2024.

The squeeze is on.
Leave a Reply