
“When clouds appear, wise men put on their cloaks.” – Shakespeare
Hyman Minsky famously said that stability creates instability. Good times sow the seeds for bad times because people believe that stability will be the norm and growth will continue uninterrupted. This results in borrowers and lenders taking on more risk because cash flows are deemed to be secure and growing with very little risk assigned to them being volatile and dropping.
Leverage increases and loan structures become based more on future growth and value than what is currently in place. In short, a margin of safety is eroded until something changes and the weak edifice is exposed and the house of cards implodes. For economic and financial data junkie, I can’t think of a better website than FRED. This is the financial data site under the auspices of the Federal Reserve Bank of St. Louis. They have data for almost every imaginable financial and economic statistic. These include some of the most well known and widely followed like employment, inflation, and interest rates to some very esoteric ones like consumer confidence surveys for Brazil. Rather than going out to a movie, a nice restaurant, or bar for an enjoyable and social evening, there are some nights I choose to stay home and leaf through FRED to discover some very unusual pattern or relationship between variables via some of these esoteric FRED statistics.
I know, I’m a wild and crazy guy.
A few of the ones I’ve been paying attention to recently are the financial stress indicators that are crafted by the Federal Reserve Banks of St. Louis, Kansas City, and Cleveland. They use many different financial market variables to determine if stress is building up in the system, or is already fully present, or complacency (high appetite for risk and minimal fear of problems arising). Here are the current readings for all three:
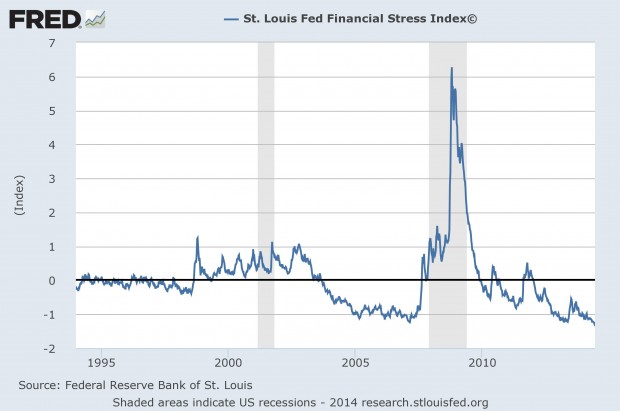
“The STLFSI measures the degree of financial stress in the markets and is constructed from 18 weekly data series: seven interest rate series, six yield spreads and five other indicators. Each of these variables captures some aspect of financial stress. Accordingly, as the level of financial stress in the economy changes, the data series are likely to move together. The latest STLFSI press release, with commentary, can be found at http://www.stlouisfed.org/newsroom/financial-stress-index/ How to Interpret the Index The average value of the index, which begins in late 1993, is designed to be zero. Thus, zero is viewed as representing normal financial market conditions. Values below zero suggest below-average financial market stress, while values above zero suggest above-average financial market stress.”
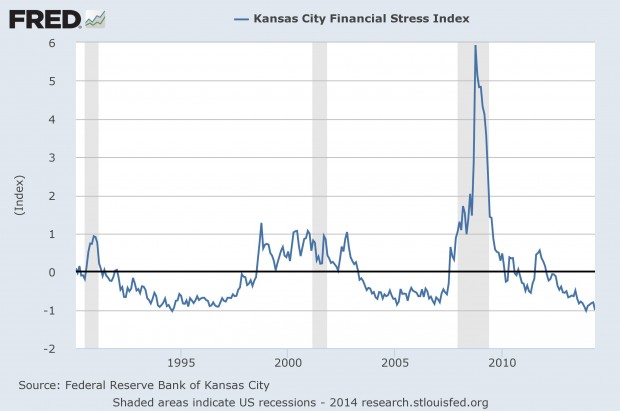
Here is a very detailed article explaining the Kansas City Fed Stress Index.
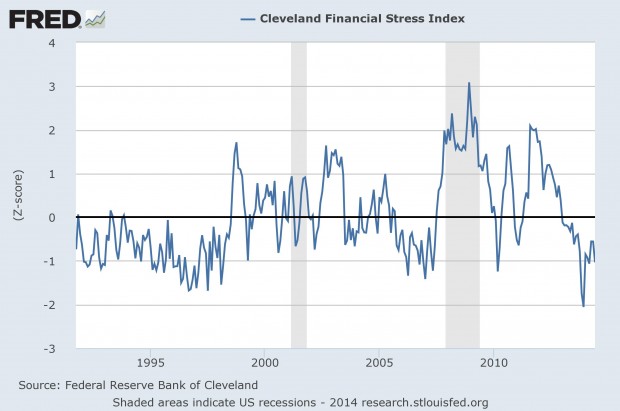
The CFSI is designed to track distress in the US financial system on a continuous basis giving the financial-system supervisors the ability to monitor stressful episodes as they are building in the economy. Such early detection is important because financial stress can quickly be amplified when stress is occurring in more than one market. The CFSI tracks stress in six types of markets: credit markets, equity markets, foreign exchange markets, funding markets (interbank markets), real estate markets, and securitization markets. The CFSI is a coincident indicator of systemic stress, where a high value of CFSI indicates high systemic financial stress. Units of CFSI are expressed as standardized differences from the mean (z-scores). The CFSI data for weekends and holidays is extrapolated. To interpret the stress continuum, CFSI is first divided it into four levels or grades. The grade thresholds are dynamic and move slowly over time. The four grades are: Grade Description Range Grade 1 Low stress period CFSI < -0.733 Grade 2 Normal stress period -0.733 ≥ CFSI < 0.544 Grade 3 Moderate stress period 0.544 ≥ CFSI < 1.82 Grade 4 Significant stress period CFSI ≥ 1.82 It’s pretty clear from all three that there is very little stress in the U.S. financial markets. Two of the more interesting data sets in the Cleveland Fed’s Stress Index relate to commercial real estate. They are an indicator for pricing relative to 5-year Treasury yields and spreads on commercial mortgage-backed securities (CMBS). Here is the first one related to valuation:
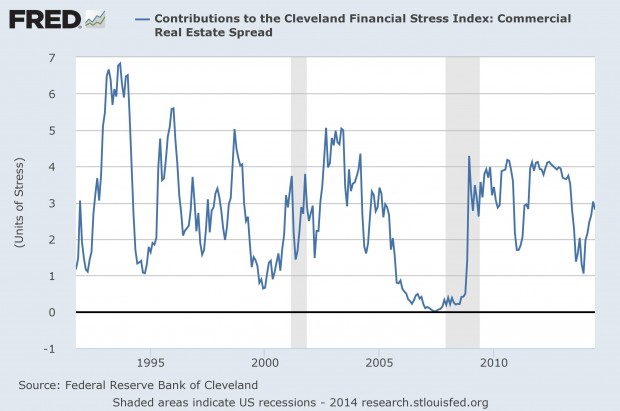
The index is hovering right around its long-term average. Interestingly, the next graph shows how hot the CMBS market has become so one would have expected valuations to be higher (risk index lower).

Admittedly, the scale is more narrow for this index than it is for commercial real estate. Nevertheless, there has been a much greater risk tolerance among CMBS lenders than among commercial real estate investors. I went back and looked at the correlations between the two indices. On a concurrent basis, they are slightly positive but with no statistical credibility.
When I created a lag of 518 days (approximately 25 months) the correlation was -.61, which is a pretty decent negative correlation. Essentially this is saying that when real estate values are high or low, then CMBS spreads are low or high a little more than two years later. This makes sense as nothing stays high or low forever.
Compelling values result in investors stepping up to take advantage of them during periods of higher uncertainty. This puts a floor on values and rents eventually rise due to an improving economy usually combined with minimal new supply. This gets lenders and debt investors more comfortable about the asset class and more interested in lending. This leads to more competition among lenders to make loans and lowers the cost of capital for borrowers relative to risk-free Treasury securities. The opposite is true of course as well.
When people believe the good times will continue they will pay high prices for properties and eventually, reality turns out differently than what they were expecting. Performance of the investments disappoints, lenders, perceive more risk, and lending standards tend to tighten up. Right now it appears that CMBS spreads are very compressed due to the high perceived uncertainty and risk among real estate investors two years ago.
Property performance has been strong, defaults low, and the global search for yield quite insatiable. This has led to a tremendous demand for CMBS paper and this has benefitted borrowers. Although from the index it does not appear that investors are overly euphoric and aggressive in terms of the prices they’re paying for properties, it does feel like this is changing a bit on the ground competing for properties.
We are finding it more competitive when we’re bidding on properties and we’re also noticing that lenders across the board are becoming more aggressive. This is translating into properties trading at higher valuations than they did six months or so ago. While we remain bullish on apartments, we are always cognizant of the fact that people might price in a more rosy future than we believe will be the case. This necessitates us maintaining a disciplined approach to pricing even though we are bullish about future apartment Net Operating Income growth. This makes it especially challenging to remain disciplined but we must do so to avoid making poor investments.
Our experience has been that this pays dividends in the long run since markets always ebb and flow and during times when optimism and greed begin to take the reigns, it is more wise to be a bit more sober and fearful in our approach. I started this post with a quotation from the Bard so I thought it appropriate that I end with one as well:
“Oft expectation fails, and most oft there
Where most it promises; and oft it hits
Where hope is coldest, and despair most fits.”
Leave a Reply