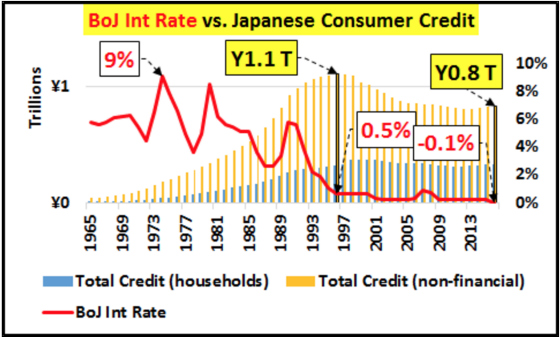
 One of the principal reasons I have been in the camp of interest rates remaining low for many years to come relates to demographics. I have always thought that Japan is the canary in the coal mine in terms of being on the leading edge of a rapidly aging society and how this filters through to lower interest rates. Japan has now made the unfortunate transition to a shrinking population and what now seems like permanently low (sub-1%) interest rates. As the following graph depicts, with a few exceptions, short-term interest rates in Japan have been below 1% since 1995 and are now negative.
Rapidly Aging – Japan
Beginning in 2000 Japan’s elderly population exceeded the population of its children (0 to 14) for the first time. Older people save more and aging societies produce less economic output than younger ones which, holding everything else constant, should result in lower interest rates. One thing that struck me is the work done by Chris Hamilton at Seeking Alpha regarding the tremendous government debt growth that has taken place as Japanese society has aged. Private sector credit demand has been moribund and interest rates have followed while government spending has picked up the slack to keep GDP growing as the following two charts show.

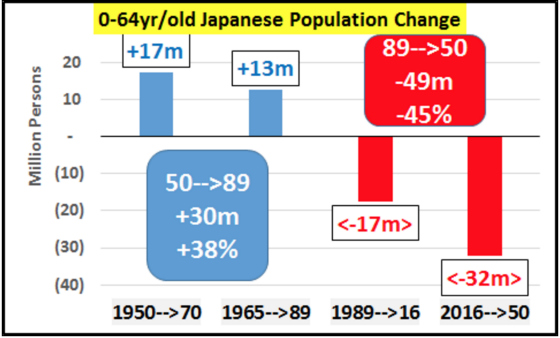
These next two charts show how the Bank of Japan assets have grown significantly in the face of a shrinking 0-64 population and much slower growth in the economy.

The prospects look even more dismal in terms of future economic output as the 0-64 population is projected to shrink by another 32 million between 2016 and 2050.
There seems to be a connection between a shrinking under 65 population, slower GDP growth, a reduction in consumer debt, lower interest rates, and an explosion in the Bank of Japan’s balance sheet. Some of this already happening in the United States without the under 65 population dropping. Fortunately, unlike much of the developed world, according to the U.S. Census Bureau, the 0 to 64 population is still projected to grow between now and 2050, albeit by only approximately 0.4% per year. Here are the projected populations for the 0-14 age cohort and 65+ in 2016 and 2050:
United States
| 2016 | 2050 | % Change | |
| 0 to 14 | 61.04 million | 66.48 million | 8.9% |
| 65+ | 49.42 million | 88.00 million | 78.1% |
Source: U.S. Census International Database
Just for kicks, let’s see how Japan and Germany compared to the United States.
Japan
| 2016 | 2050 | % Change | |
| 0 to 14 | 16.44 million | 11.66 million | -29.1% |
| 65+ | 34.57 million | 42.94 million | 24.2% |
Source: U.S. Census International Database
Germany
| 2016 | 2050 | % Change | |
| 0 to 14 | 10.36 million | 9.74 million | -6.0% |
| 65+ | 17.56 million | 21.50 million | 22.4% |
Source: U.S. Census International Database
If 49 million people are starved for yield in the United States and 100 million when Japan and Germany are added, what will the demand be for safe yield over the next 34 years when the combined 65+ population of those three countries approaches 150 million? And this doesn’t include those who are accumulating savings in their 30s, 40s, and 50s. And we haven’t even thrown China and India into the mix. Stay tuned for these tables.
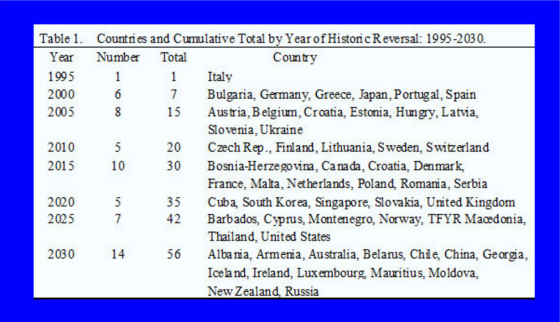
According to research done by Joseph Chamie, an independent demographer, this phenomenon of the elderly population exceeding the 0 to 14 population, which started off with Italy in 1995 and then spread to six more countries by 2000, is going to be far more widespread as time passes. The following table shows which countries have been added to the list and which ones will make it in the future.
Source: http://www.ipsnews.net/2016/08/the-historic-reversal-of-populations/
The United States crosses the demographic rubicon in 2025 with China and Russia following in 2030. The following chart shows what is projected to happen on a global basis. The tipping point is slated to occur in 2075. As the table above shows, however, much of the developed world is already there or will be there relatively soon.

Source: http://www.ipsnews.net/2016/08/the-historic-reversal-of-populations/
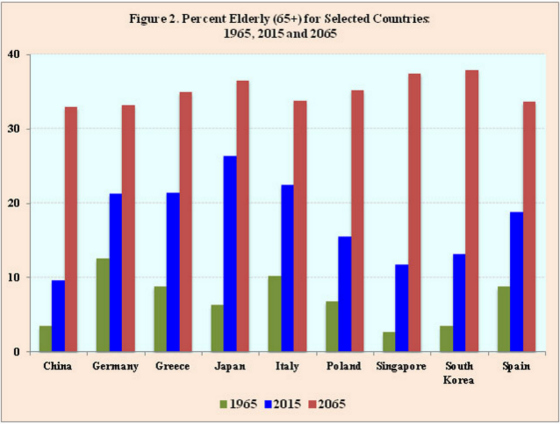
This next chart shows how some countries have been aging rapidly over the last 50 years and will continue to do so for the next 50 years.
Source: http://www.ipsnews.net/2016/08/the-historic-reversal-of-populations/
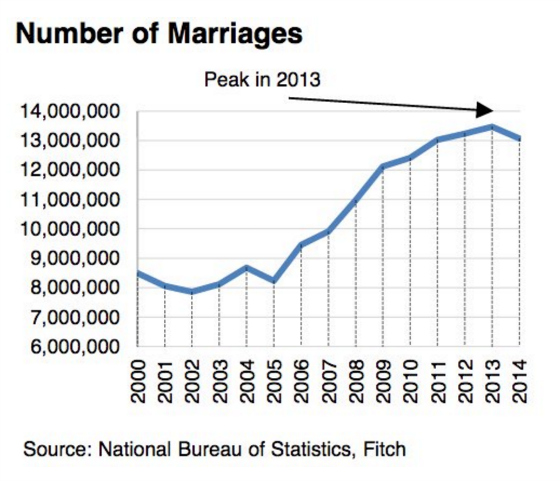
Speaking of China, here are some interesting social and demographic charts. Similar to the United States, the number of marriages have peaked. I imagine much of the plateauing has to do with people getting married later as is the case in the United States. One of the other main challenges is the imbalance between males and females. According to the Census Bureau, there are approximately 117 million males in China between the ages of 20 and 29 and 109 million females, representing a ratio of 1.08 males for every female in that age cohort. This isn’t dramatically different from the United States’ ratio of 1.05. What is really challenging and quite disturbing is the trend among the 0 to 19 population in China. Whereas the ratio between males and females for this age cohort remains stable at 1.05 in the United States, in China it explodes to 1.17! It is going to become far more challenging for Chinese males to find Chinese females to marry unless women are imported or they leave China and marry foreign women.
The next chart will also have implications for global interest rates. Most people think of China as a very rapidly growing economy, which it has been since 1978. The following chart, however, shows how successful China’s one-child policy has been as there is going to be a very significant drop in the working age population going forward.
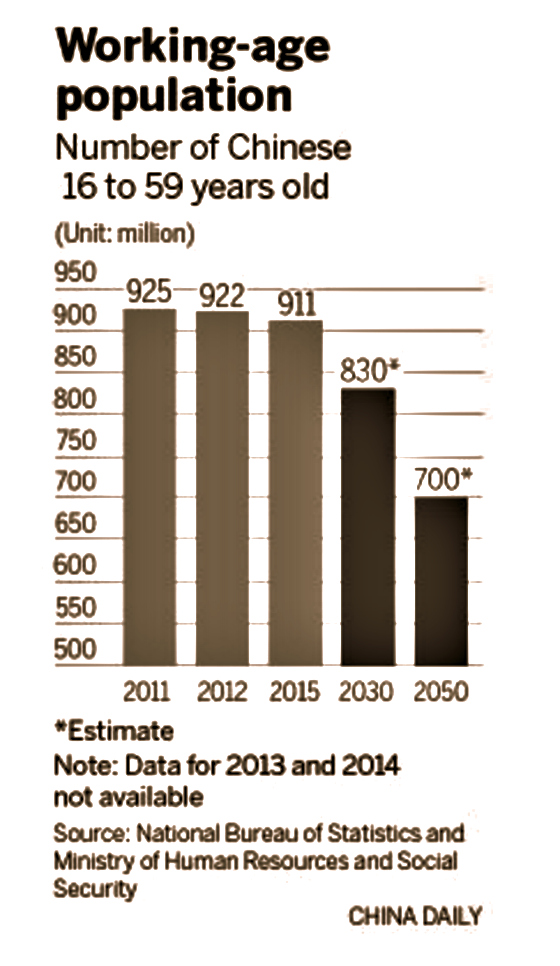
This will have huge implications for China’s ability to grow. Economic output is a function of hours worked and productivity. With the working age population dropping by over 200 million people over the next 35 years, China will be hard pressed to keep up its rapid growth without enormous gains in productivity. China is already moving down’s Japan’s path of significantly increasing government spending to make up for slowing consumer spending as its society ages. I only see this becoming more pronounced as private spending will over time be overshadowed by the desire for savings.
I showed earlier how the United States, Japan, and Germany will be adding approximately 50 million more 65+ people to their populations, thereby putting more pressure on interest rates as they desire to save more and spend less (health care being the main exception). These numbers are just specks of dust when compared to what is projected to happen in China and India between now and 2050. Let’s see how the tables look for these two behemoths.
China
| 2016 | 2050 | % Change | |
| 0 to 14 | 234.90 million | 170.76 million | -27.3% |
| 65+ | 142.12 million | 348.14 million | 145.0% |
China is going to see its younger population shrink by 64 million while it 65+ population will explode by more than 200 million between now and 2050. These are truly tectonic shifts not only for China but for the global economy as well.Source: U.S. Census International Database
China is going to see its younger population shrink by 64 million while it 65+ population will explode by more than 200 million between now and 2050. These are truly tectonic shifts not only for China but for the global economy as well.
India will see a more modest drop in its 0 to 14 population (23 million) while its 65+ age cohort will grow by an eye-opening 166 million. Not quite as high as China’s but still enormous on an absolute basis.
India
| 2016 | 2050 | % Change | |
| 0 to 14 | 351.03 million | 328.21 million | -6.5% |
| 65+ | 77.15 million | 243.40 million | 215.5% |
Source: U.S. Census International Database
As a side note, like China, India too will experience challenges for its males to find female marriage partners as its ratio of males to females for its 0 to 19 population is 1.13.
Let’s add up all of the countries I created tables for to get a global proxy for the developed and developing the world in terms of future population age structure.
Global Proxy
| 2016 | 2050 | % Change | |
| 0 to 14 | 673.7 million | 586.9 million | -12.9% |
| 65+ | 320.8 million | 744.0 million | 131.9% |
Perhaps negative interest rates are truly the new normal and are foreshadowing a world of deeply deficient demand due to rapidly aging societies, a huge desire for safety and yield around the world, and governments needing to fill the demand deficiency through deficit spending with the added benefit of putting more safe, sovereign securities in the hands of hungry savers.With over 400 million people entering the ranks of 65+ and a shrinking 0 to 14 population in this data set, does this look like a world that will be comprised of people that will drive significant growth in consumer spending or will the desire to save be most paramount? These statistics would suggest it will be the latter which in turn points to lower interest rates for decades to come.
Perhaps negative interest rates are truly the new normal and are foreshadowing a world of deeply deficient demand due to rapidly aging societies, a huge desire for safety and yield around the world, and governments needing to fill the demand deficiency through deficit spending with the added benefit of putting more safe, sovereign securities in the hands of hungry savers.
Over to You:
Modern medicine is responsible for people around the world living into their 80’s, 90’s and even 100’s. Will these aging societies be responsible for continued lower interest rates or potentially negative interest rates?
Leave a Reply