
The last few weeks have been a good representation as to why I have an aversion to fixed-rate loans when doing a refinance or an acquisition. Assuming fixed rate loans from sellers when acquiring properties, however, is a different story and worthy of its own write up so I won’t address the distinctions here.
When procuring new fixed-rate financing for a refinance or acquisition borrowers are at the mercy of a moment in time in the bond market because it is then when you have to lock in the rate that will be in place for the next five, seven, or ten years (typical loan terms). And once you’re locked there is no turning back because you are pretty much stuck with that loan and rate for many years to come because of the onerous pre-payment penalties built into them. If you hit the market right then good for you. If, on the other hand, your timing is bad you may end up leaving a fair amount of money on the table. For example, someone I know was arranging fixed-rate financing for one of his clients who was closing on an acquisition and wanted to send out his pro forma and marketing materials to his investors to bring in the equity in a relatively short period of time. To do this, however, he wanted the interest rate fixed so he could put out a set of projections that wouldn’t change from a debt service standpoint. Unfortunately, his timing was terrible.
My friend’s client locked an approximately $80 million loan when the 10-year Treasury note yield peaked at 3.11%, resulting in a rate of approximately 4.45%. Today. If you were to lock in that rate it would be more like 4.25%. Now, one may argue, that’s not that big of a difference but approximately 0.20% point per year on $80 million will add up to over $1.5 million during the life of the loan. To me, that is real money. It also makes your prepayment penalty higher than it otherwise would have been because the lender needs to be compensated for getting a higher interest rate loan repaid early.
Some lenders are becoming a bit more flexible in terms of when they will let you lock in the rates for new loan originations. This then begs the question as to whether there is anything one can learn from past interest rate increase cycles about when it may be an optimal time to lock one’s rate. Like I have been doing the last couple of weeks, I turned to the numbers to see if there is anything I could learn. The results are pretty interesting and do suggest that there are definitely better times than others to lock rates.
Before turning to the numbers, however, I thought it would be enlightening to show how much seasonality there is in the 10-year Treasury market. What follows is a chart from sentimentrader.com showing the seasonality of 10-year Treasury note yields. One can clearly see that January and July through November have historically been the most positive months in terms of seeing Treasury yields fall so keep that in mind when locking in loans.

Now let’s look at my analysis. You will see from the data presented below that movement in Treasury yields tend to happen in clumps over relatively short periods of time.
The Importance of Quantum Phases
My analogy I like to use is that of a quanta in physics. This is essentially a discrete amount of energy that is needed to create certain interactions. It’s far more complicated than that but think of something like an electron only being able to move to a different orbit when this specific amount of energy is available or a multiple of it. This is how I view rate movements. It’s calm, calm, calm and then something happens to change the energy state. And it’s this change in the energy state that leads to big rate movements in relatively short periods of time.
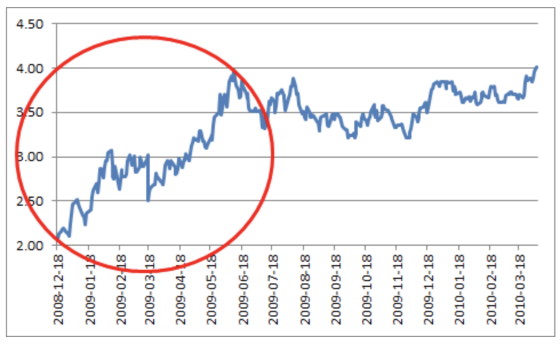
The following charts show some examples of the quantum moves during different interest rate increase cycles for the 10-year Treasury. I will focus on interest rate decrease cycles next week as I think we may be in one of those quantum states now. In addition, I want to see if the same situation holds for down cycles as it does for up cycles in terms of having quantum phases.
The first chart below was a relatively short cycle and was pretty much all up except for the first couple of weeks.

The next charts have the quantum portions circled for three other cycles.

I wanted to quantify how important the quantum phases were to the overall move in rates during the full cycle and whether these movements took place over shorter periods of time. I did this by disaggregating the data by breaking down daily moves into higher or lower rates and ignoring days when yields did not change based on closing yields. I then looked at what percentage of the cumulative interest rate increase came from the quantum and non-quantum phases and what percentage of time each phase represented in the cycle. The data and analysis confirm my hypothesis about quantum moves.
Here is the information.
6/13/2003 – 6/14/2004
| % of Cycle | Basis Point Move | % of Basis Point Move | |
| Non-Quantum | 77.0% | 28 | 15.9% |
| Quantum | 23.0% | 148 | 84.1% |
| Total Basis Point Move | 176 |
6/2/2005 – 6/24/2006
| % of Cycle | Basis Point Move | % of Basis Point Move | |
| Non-Quantum | 57.1% | 47 | 34.6% |
| Quantum | 42.9% | 89 | 65.4% |
| Total Basis Point Move | 136 |
12/4/2006 – 6/12/2007
| % of Cycle | Basis Point Move | % of Basis Point Move | |
| Non-Quantum | 50.9% | 13 | 15.7% |
| Quantum | 49.1% | 70 | 84.3% |
| Total Basis Point Move | 83 |
12/8/2008 – 4/5/2010
| % of Cycle | Basis Point Move | % of Basis Point Move | |
| Non-Quantum | 65.3% | 8 | 4.1% |
| Quantum | 34.7% | 185 | 95.9% |
| Total Basis Point Move | 193 |
10/8/2010 – 11/2/2011
| % of Cycle | Basis Point Move | % of Basis Point Move | |
| Non-Quantum | 64.6% | 48 | 35.8% |
| Quantum | 35.4% | 86 | 64.2% |
| Total Basis Point Move | 134 |
6/1/2012 – 12/31/2013
| % of Cycle | Basis Point Move | % of Basis Point Move | |
| Non-Quantum | 77.8% | 25 | 15.9% |
| Quantum | 22.2% | 132 | 84.1% |
| Total Basis Point Move | 157 |
And here is the latest cycle assuming that the 3.11% yield reached on May 17th is the cycle high.
7/8/2016 – 5/17/2018
| % of Cycle | Basis Point Move | % of Basis Point Move | |
| Non-Quantum | 72.9% | 67 | 38.5% |
| Quantum | 27.1% | 107 | 61.5% |
| Total Basis Point Move | 174 |
It’s pretty clear that the quantum phases are typically much shorter than the non-quantum phases and are much more powerful. The takeaway is that if you’re going to lock rate it sure is better to be in a non-quantum phase in an up cycle and to be in one during the down cycle. As I stated previously, I have not analyzed the down cycle phases yet but I’m sure they behave similarly. I’ll focus on that for next week.
How Do You Know When Quantum Phases Occur
Of course we never truly know until after the fact if we’re in a quantum phase but if volatility starts increasing then pay close attention. One thing I didn’t put in the chart but did calculate was the average daily basis point move for both up and down days for the two phases. And in every cycle with the exception of two, both changed much more significantly during the quantum phases but the up days did so with even more velocity. Even if they both dropped in velocity the down days did so much more significantly which contributed to the power of the quantum phase.
I will sign off with the same chart I have been showing over the last few weeks from sentimentrader.com of the hedger’s position in the futures market for 10-year Treasuries. With the decent move down in rates, I was curious to see if they became less bullish. The answer is no. They have actually become more so.

Seasonally June is not a great month so we may not see yields move much lower until July when things kick into high gear as the first chart in this post shows. To corroborate this somewhat, this is what sentimentrader had to say about the very long positioning of “smart money” hedgers in the futures market:
“The latest Commitments of Traders report was released, covering positions through Tuesday. According to the 3-Year Max/Min Screen, “smart money” hedgers moved to a new multi-year long position in 10-year Treasury futures. According to the Backtest Engine, over the past 20 years when hedgers held more than 17% of the open interest in 10-year futures, the 10-year rallied over the next three months 96% of the time.”
It would appear that if one can hold out locking rates until July and August given the seasonality, positioning of hedgers, and the possibility that we may be in a quantum phase that may accelerate, then this could provide the best risk-reward for those looking to lock in new fixed-rate financing.
Leave a Reply