

I must say that when I read this tweet last week, I felt heard, listened to, and understood. It was cathartic in a way.
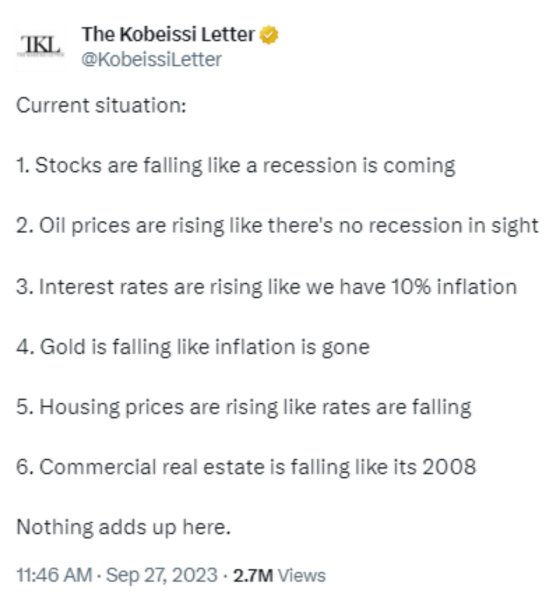
I know I’m being a bit melodramatic, but there are so many cross-currents in the economy that it has made forecasting quite challenging. Conversely, this tweet does inadvertently lend credence to the rolling recession hypothesis that while some important sectors may be contracting, there are enough other ones growing to avoid an overall recession. With that being said, it also feels like a lot of pressures are building, with rates being much higher and seemingly staying there for a while in conjunction with very aggressive monetary tightening.
The situation reminds me of the famous battle scene from Braveheart in which Mel Gibson’s character keeps holding his soldiers off from attacking. He sees a large number of enemy soldiers approaching on horseback, and yet, he keeps telling his men to “Hold, hold, hold, hold” until, finally, at the optimal time, he yells, “Now!” and the battle begins unleashing incredible brutality and carnage as the attackers were not prepared for the surprise William Wallace’s forces had waiting for them.
The Fed has been willing and continues to be willing to slowly strangle the economy and won’t release its grip until some catalytic force is unleashed that requires them to act. It believes that it will be able to act just at the right time and has enough ammunition to pull off the immaculate soft landing. History would suggest the odds of this are small. More on this in a bit.
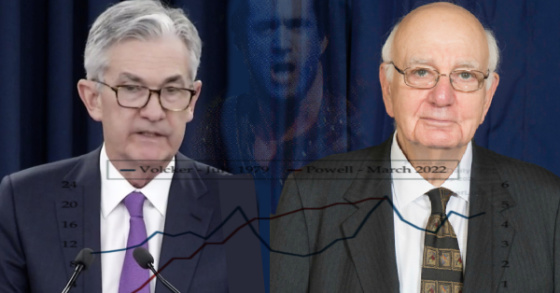
Jay Powell vs. Paul Volcker
Let’s look at some charts that suggest that the wheels are already in motion for the squeeze the Fed is putting on the economy, which will require the Fed to cut rates. For some context, this chart shows how Jay Powell’s tightening campaign is only six months from equalling Paul Volcker’s brutal one that started in 1979. It appears that Powell has no issue Volckerizing the economy to stamp out inflation and provide plenty of room to cut materially in the future if he deems that necessary.

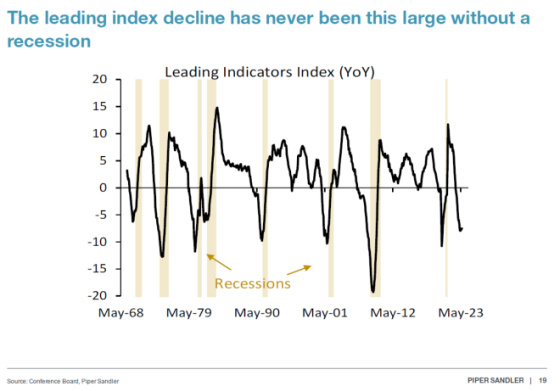
This chart shows that the Leading Economic Indicators Index has never been this far in contraction territory without a recession ensuing.
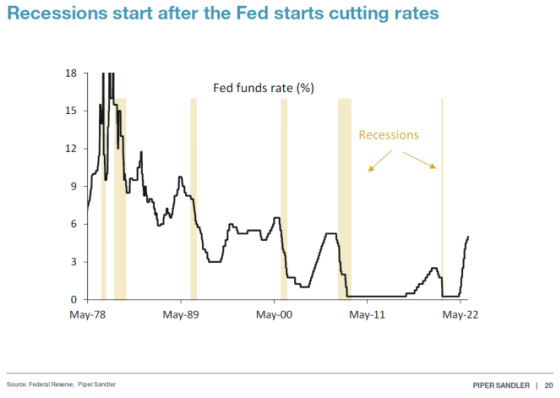
On the other hand, as this next chart shows, recessions don’t begin until the Fed starts cutting rates, so perhaps it now makes some sense why the LEI has been so low for so many months without a recession starting. It could be because the Fed hasn’t started to cut rates yet!
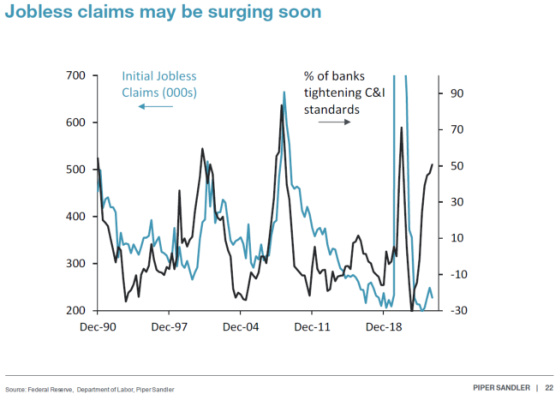
While the labor market looks healthy, this chart shows that unemployment claims tend to shoot up when banks tighten credit significantly as the economy is so reliant upon credit flowing smoothly and abundantly to keep the engine’s economy humming and people employed. With banks having tightened credit quite materially, it’s possible that this slowing labor market could turn into one that is contracting over the next six months or so.
There is a fairly sizable gap between Gross Domestic Product (GDP) and Gross Domestic Investment (GDI). We shall see which one is correct. If it’s the latter, then the GDP report has been overstating the strength of the economy, and if it’s the former, then GDI has been understating the economy’s strength.

Back to Braveheart. This chart shows how the Fed is aggressively contracting its balance sheet, and while it’s having the desired effect on CPI, it’s too early to declare victory and take the foot off the break. Powell is yelling “Hold, hold, hold, hold” in terms of keeping rates where they are, which is now meaningfully higher than inflation, and producing very high real interest rates that take time to filter its way through the economy.
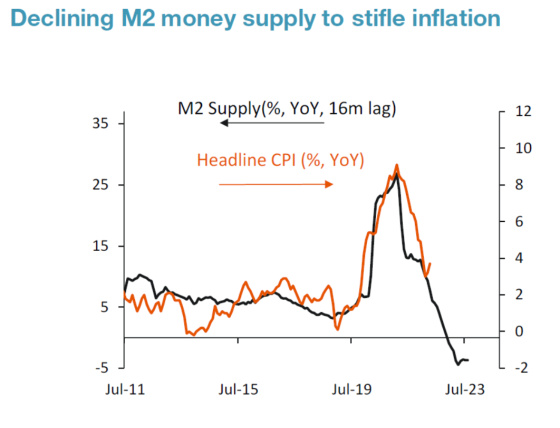
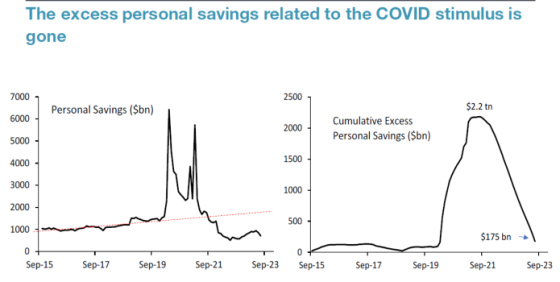
The contraction in the money supply, along with lingering inflation and the cut in government benefits, is probably having an effect on many Americans and requiring them to tap into their savings. In addition, with the resumption of student loan payments, more savings will be drained as well.
This regression analysis and resulting graph suggest that the Fed should be done tightening since the Federal Funds Rate is at a level that reflects being at a peak based on past tightening cycles.

Finally, this chart shows the magnitude of the inverted yield curve. One can see that this cycle is only exceeded by Volcker’s era, although rates were much higher then.

Applying the laws of physics to Fed policy in which what goes up must come down, this chart shows that if past cycles are any guide, then short-term rates can come down quite a bit.


Leave a Reply