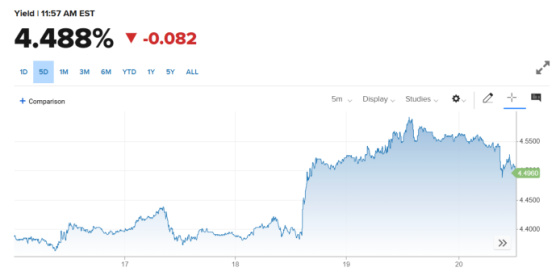
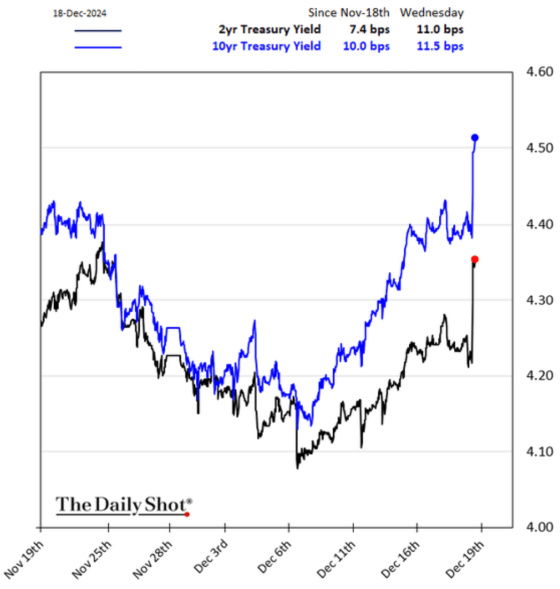
Last week was a very bad week for the bond market, with some reprieve on Friday after a better-than-expected inflation report. This is a 5-day chart for the 10-year Treasury. Yields shot up by 0.20% after the Fed cut rates on the 18th and in the aftermath of Jay Powell’s press conference.
Before going into some analysis as to why bond yields have been shooting up, here are some remarks made by Chairman Powell highlighting his frustration with the Fed’s progress in tackling inflation.
– “We had a year-end projection for inflation, and it’s kind of fallen apart as we approach the end of the year.”
– “It’s been a bit frustrating because, while we’ve made progress, it has been slower than we had hoped.”
– “As we think about further cuts, we’re going to be looking for progress on inflation. …We have been moving sideways on 12-month inflation.”
The survey of the Fed’s economic projections show a whipsawing in terms of the risks to core PCE inflation. Just last month the Fed thought the risks were balanced between the upside and downside only to see it shift dramatically to upside risk such that it is almost back to 2022 levels when inflation was on a tear.
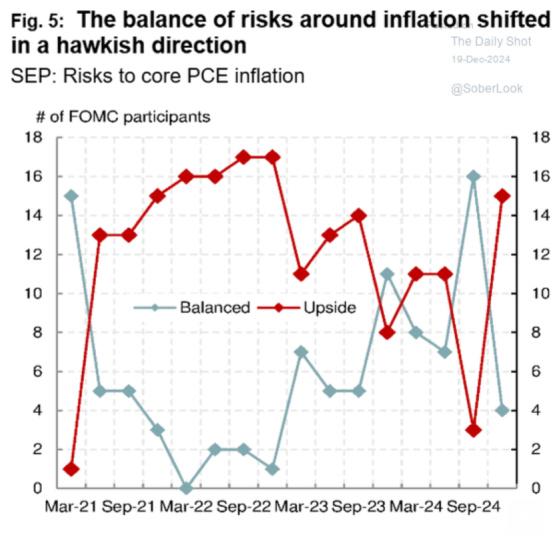
One Fed cut has now been taken off the table.
Here is another chart showing the spike in both 2-year and 10-year Treasury yields.
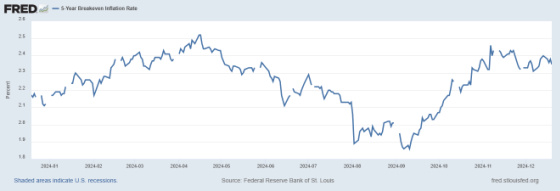
This chart shows how much of the run up in rates prior to last week was related to inflation expectations moving higher.
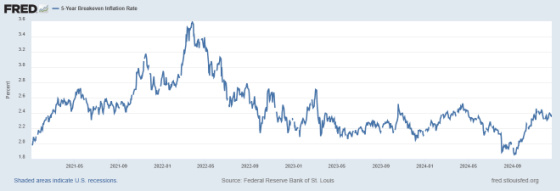
On the other hand, as this chart shows, with the exception of 2022, break even inflation rates have ranged between 2.0% and 2.5%. When they have gotten closer to 2.0% rates move up and when they get closer to 2.5% rates tend to come down.
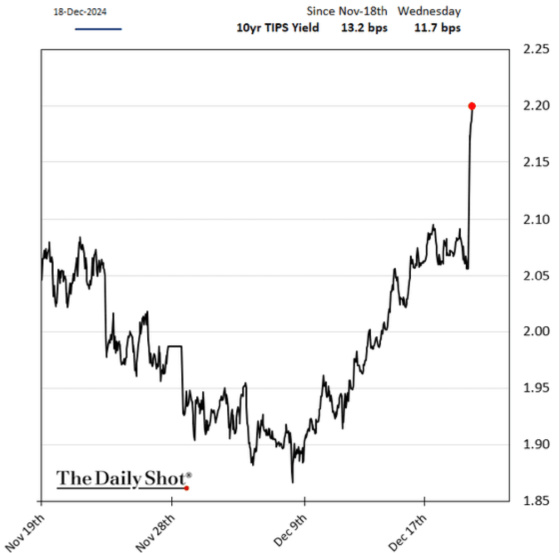
Interestingly, most of the move in rates last week was related to the market pricing in higher real rates which suggests either a more restrictive Fed intent on fighting, an economy that is projected to grow faster than previously expected, or a combination of both.
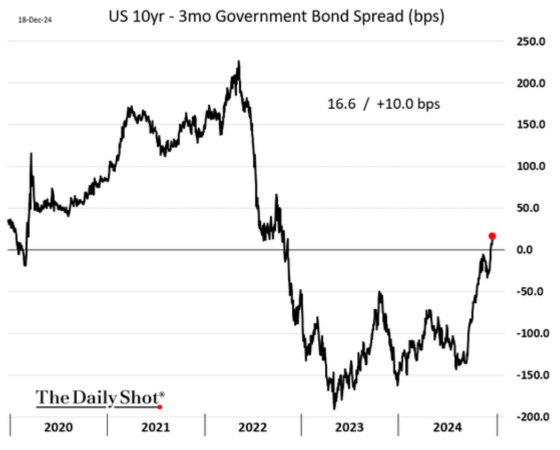
I have written many times before that recessions don’t occur when the yield curve inverts but when that inversion is reversed and the yield curve becomes positively sloped again. Up until last week, every shorter-term security had a lower yield than the 10-year Treasury other than 3-month T-Bills.
This changed last week and we are now 100% officially on recession watch.
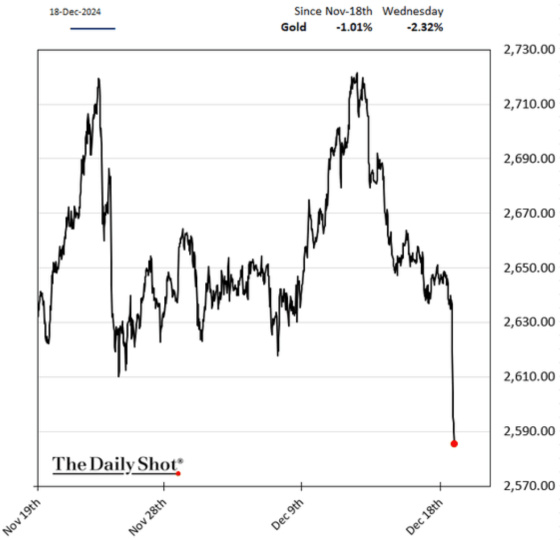
Gold took a hit and this suggests that higher real rates may be a sign of a tighter Fed fighting inflation more aggressively which is not good for gold as it is perceived as an inflation hedge.
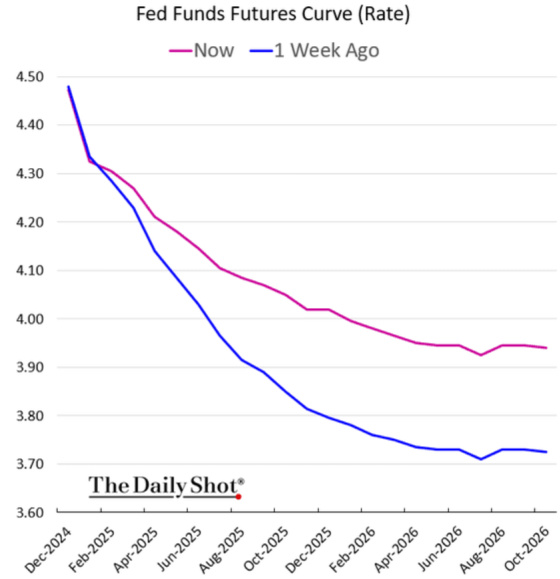
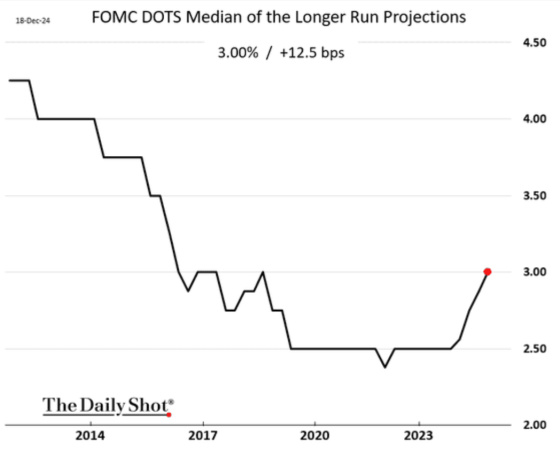
The Fed is now projecting short-term rates to bottom at 3.00% versus its previous projection of 2.50%.
Jeffrey Snider
Someone whose work I occasionally read is Jeffrey Snider. One could say that he is one of those people who is often wrong but never in doubt. With that being said, he is definitely a very independent thinker and he has a unique way of looking at the financial system from the plumbing of how capital flows throughout the banking system and economy and the importance of quality collateral in keeping the system unclogged. He believes there is great information that can be derived from swap spreads and other spreads to ascertain the health of the financial system. He has been arguing for a long time that the system is far less healthy than meets the eye. I am not well versed enough in this arcane and very complex aspect of our financial system to have a strong conviction either way.
Snider has been very critical of Jay Powell, particularly because of his data dependency. He recently posted a tweet on X that I thought was pretty insightful and helps explain some of the market’s frustrations with Powell and how he is often perceived to be pivoting and flip flopping. This is what he had to say.
What Powell said at press conference shocked and upset pretty much everyone. Here’s the quote:
“I think the actual cuts that we make next year will not be because of anything we wrote down today. We’re going to react to data; that’s just the general sense of what the committee thinks is likely to be appropriate.”
What he’s saying is the Fed has no idea, no clue what’s going to happen in 2025. As far as they’re concerned, it could by 2022 or it might be 2008.
FOMC claims to be “data dependent” all that means is they react to the last datapoint. That’s not how this is supposed to work; data dependent means you take a position on inflation or unemployment and then see if the data lines up with it.
Here instead the Fed takes no prior position on either, reacting to the latest update and changing its stance based on it. That’s insane.
This perfectly explains their behavior: dots were higher for longer last year, then dropped with CPI rates at end of ’23 start of ’24, then dots were raised when CPIs bounced in spring only to see them drop again by Sept when rate cuts actually started.
The Fed’s fifty in Sept was thought impossible in June.
FOMC always only reacts. Since Sept, CPIs are bouncing – AGAIN. They do this, and have repeatedly. It’s not “unexpected”, disinflation is discontinuous, doesn’t go in straight line.
This whole thing is a perfect example of how stupid “monetary policy” has become. And yet, everyone is talking about — which is the whole point.
The Fed’s true purpose is to get the world to believe it is central. Job well done.
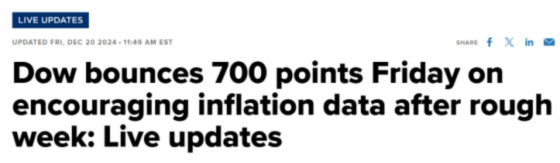
And while Snider’s language may be a bit ornery and negative I think he is spot on. The Fed should be operating from a hypothesis about the longer run inflation trends and use the data to test its hypothesis, rather than being whipsawed by it. Because it is literally in the month by month data dependent camp, the Fed is forcing investors to be as well. Hence this headline from Friday.
Co-dependent behavior creates an unhealthy attachment between two people which has the effect of bringing out the worst in both parties. And while data is not a living thing that has feelings and behaviors, inflation and jobs data seem to be triggering sub-optimal, co-dependent behaviors in Jay Powell. It’s time for Powell to recognize he has a problem and to take a stand with regard to how he sees inflation and economic growth and to work from that operating premise until there is solid and convincing evidence to the contrary. He does not need to be data dependent anymore. He just needs to be data curious.
If it were me I would say that I would expect inflation to be between 2.0% and 2.5% and that we have regained control over price stability. The wild card is fiscal and regulatory policy which could create more demand for labor than supply, especially if immigration policy is reversed, onshoring gathers great steam, construction labor becomes very tight due to deportations and aggressive infrastructure and green energy spending. All of these factors necessitate having real interest rates higher than they were during the 2008-early 2022 time frame. My goal is to keep the economy growing and the labor market healthy. For now rates are at a level that should facilitate this but if cracks appear as may be the case with the yield curve now positively sloped again and this is almost always a precursor to slower economic growth or a recession, then I would not hesitate to move the Federal Funds Rate closer to the level of the higher end of my inflation projection (2.5%).
Leave a Reply