
Just when the market prices in four cuts for 2024, either the Fed comes out to talk the market down or data is released to suggest investors are being too aggressive in pricing in the number of Fed cuts.
We are now back to the point where the market and Fed are once again aligned on the number of cuts in 2024.
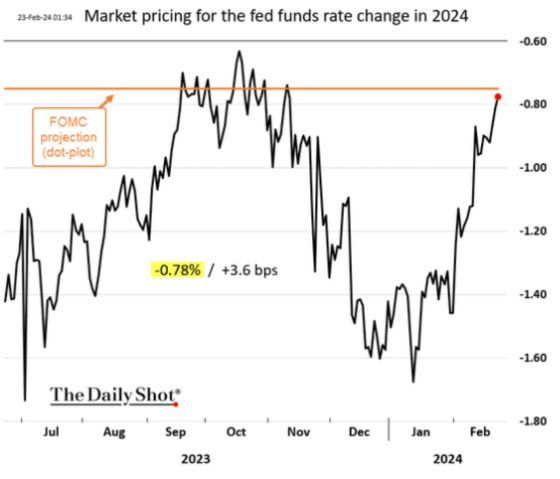
This chart shows how the market is now projecting the Federal Funds Rate in August 2025 to be approximately 0.50% higher than what it was pricing in less than two months ago. Easy come, easy go.

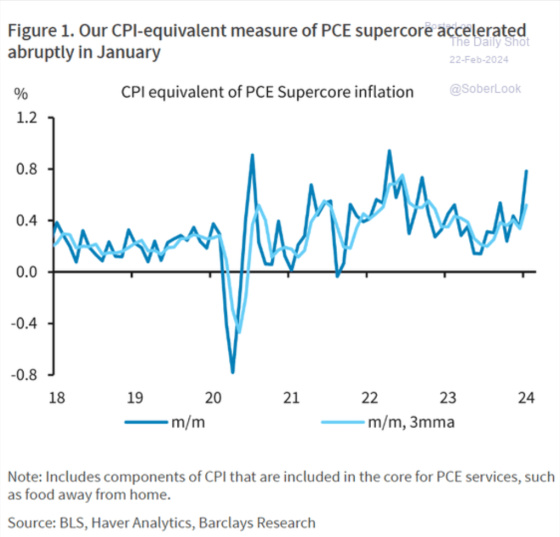
What led to the snapback in rates and the pricing in of fewer rate cuts? As I wrote about last week, it was inflation trends reversing that spooked investors.
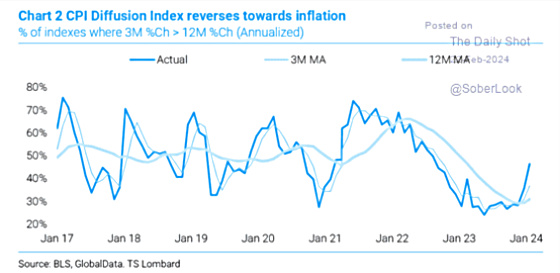
This chart shows how an increasing number of the CPI components are rising versus falling.
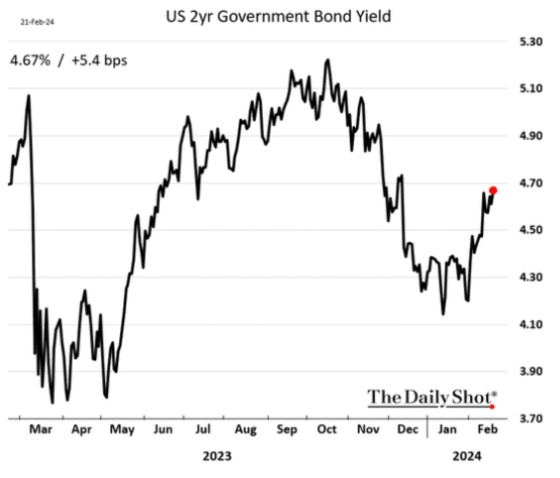
The 2-year Treasury is the Treasury note most sensitive to Federal Reserve policy and expectations. The yield on this security has increased by approximately 0.60% from its early January low.
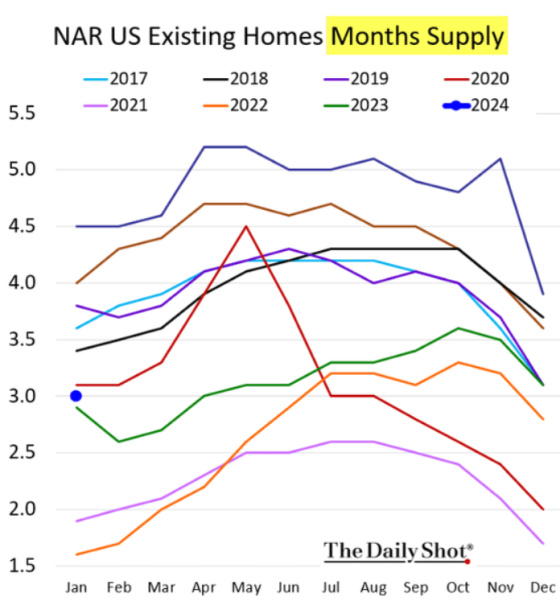
With mortgage rates again approaching 7%, this has continued to depress home purchase activity without impacting prices as so little inventory is available for sale. This is due to a large number of homeowners locked into mortgages with rates far below market. As a result, they have very little incentive to sell since most will seek to purchase another home that will be more expensive and will have to be financed using mortgages that are at far higher rates than they are paying now. This would result in a significant increase in their monthly payment.
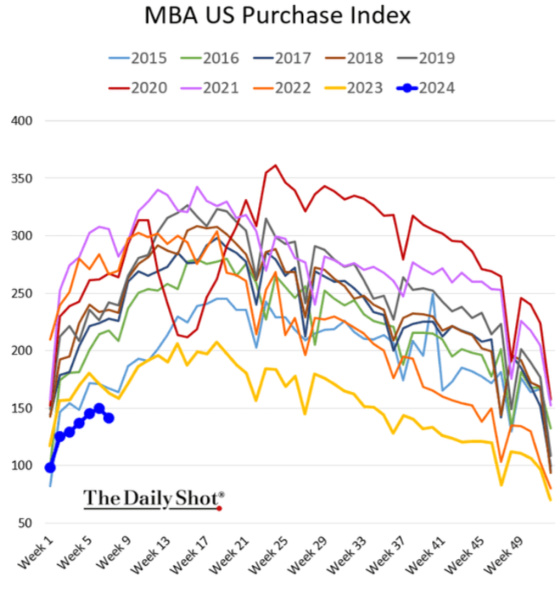
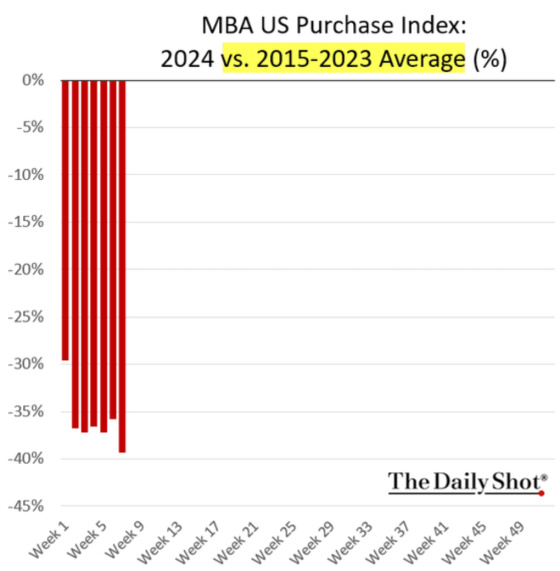
This chart is a stark depiction of how long existing home sales are.
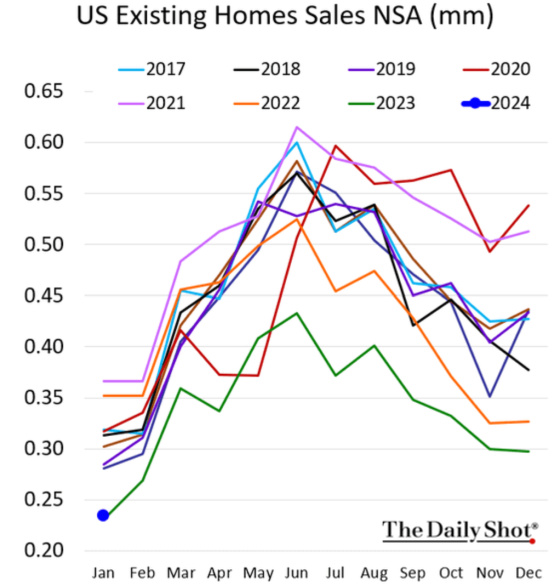
With so many people locked into mortgages with below market rates, selling and purchasing another home will result in a much higher monthly payment. As a result, so few homes are on the market.
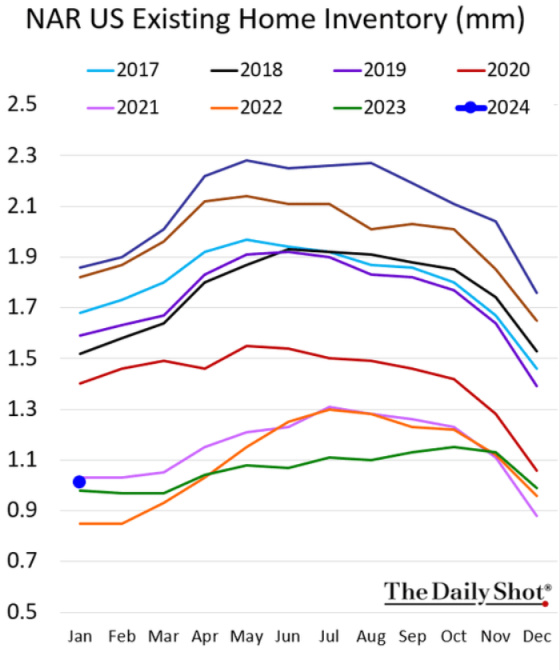
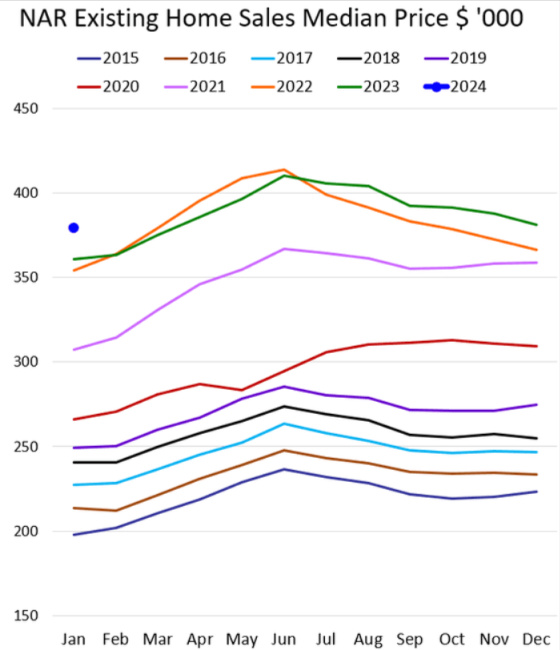
Home prices are still at record highs given there is still more demand to purchase homes than the supply available.
So why does the market keep gyrating from being absolutely convinced the Fed is going to cut multiple times to reversing course and taking rate cuts off of the table? As I have written about many times before, it comes down to persistent, unusually high deficit spending during a period of economic growth combined with resilient construction employment. The two are also correlated.
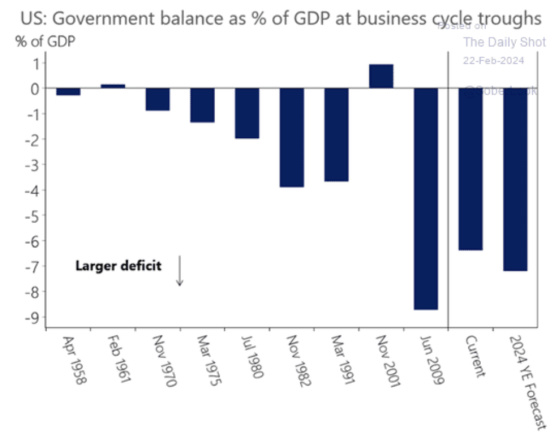
This chart shows how the level of deficits we’re running as a percentage of GDP has only occurred since 1958 during times of business cycle troughs. And, with the exception of the huge deficit run during Covid, our current and projected 2024 deficit is higher than any other recession since 1958. Given that nominal GDP growth was 5.8% year over year during the third quarter of 2023 and the deficit is approximately 6%, this means that private sector GDP is essentially not growing, and even shrinking a bit. The government is doing all of the heavy lifting.
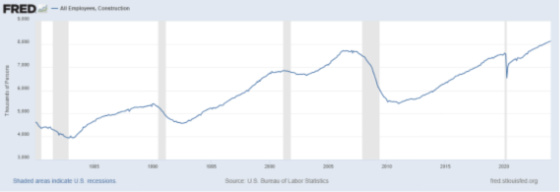
One of the main beneficiaries of the government continuing to prime the pump is construction employment. This chart shows how construction employment has been remarkably resilient in spite of much higher interest rates. Usually construction activity would drop as rates rise because this would make homes less affordable and income producing property development more difficult to make the numbers work. So far this has not been the case.
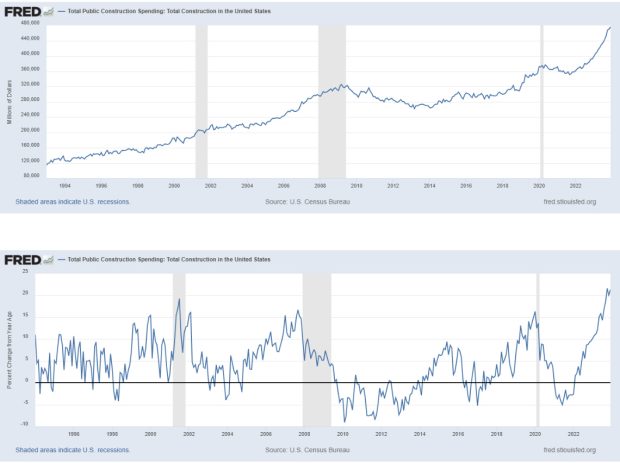
If we connect the dots between unprecedented deficit spending during an economic expansion and continued strong construction employment, one must surmise that public construction spending is increasing. And as these next two charts show, It is not only increasing but growing at a tremendous rate.
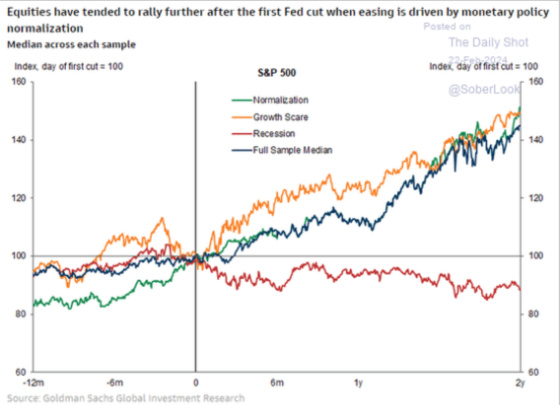
And while the stock market is hitting new highs and perhaps suggests there is no recession on the horizon which would lead the Fed to cut more aggressively, perhaps its optimism is centered around the belief that the Fed can start to cut rates to normalize the inflation-adjusted rate versus having to do so to contend with deteriorating economic conditions. The former is good for stocks while the latter is not as this chart shows.
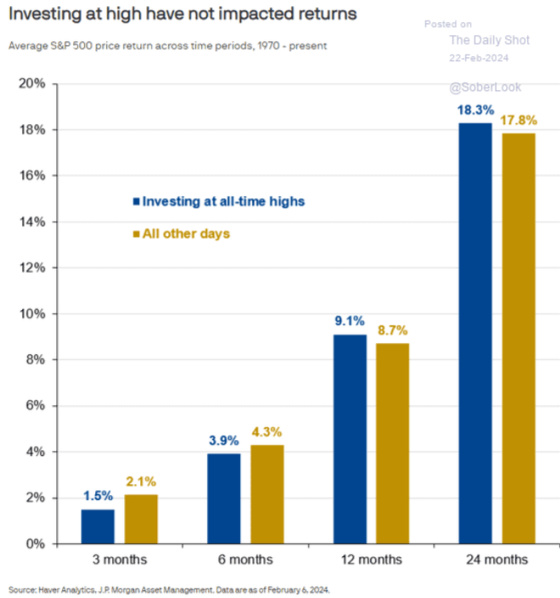
Finally, for those who might be afraid of investing when the market is hitting new highs, then this chart might give you some comfort that, on average, returns are actually higher over 12 to 24 months when investing at all-time highs as opposed to on all other days. I’m curious as to what the median return is because investing in the NASDAQ in March 2000 or Dow between October 16th was probably not very fun after the former dropped 80% and the latter crashed by 22.6% in one day on October 19th.
Until we see a meaningful pullback in federal spending and a corresponding contraction in construction employment, I think inflation pressures will continue to be present. I’m still in the camp of the 10-year Treasury being in the 3.50% to 4.50% range and short-term rates settling out at 2.50% to 3.50%.
Leave a Reply