
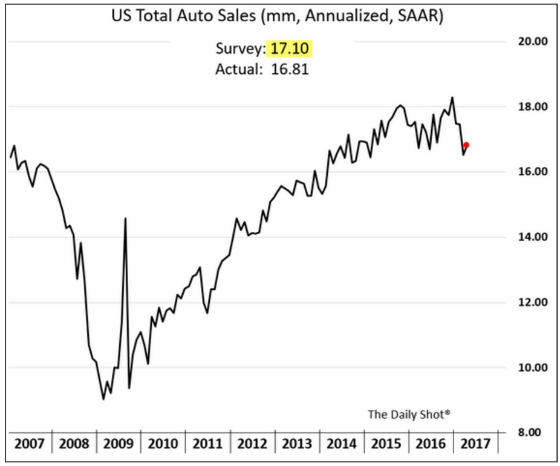
Auto sales have been one of the real bright areas of the economy ever since the “Cash for Clunkers” program ended and sales dropped back down to recessionary levels. The following chart shows how they have grown by approximately 100% from trough to peak.
Auto Sales
Unfortunately, it now appears that sales growth will face some significant headwinds. Inventory is too high, too many cars are coming off leases that may be underwater, and the performance of auto loans is deteriorating. Lenders are tightening credit and the demand for auto loans is dropping as the next chart shows.

Seeking Alpha is an excellent site to get information from companies and about companies to dive more deeply into particular trends. The site recently summarized analysis done by Height Securities’ Edwin Groshans regarding used auto financing. He noted the following:
- He estimates cautious lenders poised to take $4B-$5B of credit from the used car market.
- He notes Fifth Third Bancorp CFO Tayfun Tuzun saying “reducing capital deployment” is the right move at this time. Tuzun expects his bank’s auto loan portfolio to fall to 23-28% by 2019.
- TCF Financial on its earnings call said it plans to reduce auto originations by 30-40%.
- Then there are “disciplined” underwriting standards at subprime specialist Santander Consumer where auto originations fell 21% Y/Y in Q1.
And if this sounds eerily similar to the subprime mortgage bubble that propelled home sales to stratospheric levels, then you’re right. The major difference is that auto loans aren’t large enough to take the economy down with it like the mortgage meltdown. Since automobile manufacturing, sales, and service have very large spillover effects, however, it won’t be without pain if a correction ensues.
Auto Finance Market
Here is an excerpt from a Bloomberg article on the auto finance market that shows many of the same trends that were present in mortgage securitizations as credit quality deteriorated and then eventually unraveled.
About a third of the risky car loans that are bundled into bonds are considered “deep subprime,” a level that has surged since 2010 and is translating to higher delinquencies on the loans, according to Morgan Stanley.
Consumers are falling behind on most subprime car loans, but deep subprime borrowers have deteriorated fastest, the analysts said. Sixty-day delinquencies for bonds backed by these loans have risen 3 percentage points since 2012, compared with just 0.89 percentage points on all other subprime auto securities, Morgan Stanley’s Vishwanath Tirupattur, James Egan and Jeen Ng said in a report dated March 24.
“The securitization market has become more heavily weighted towards issuers that we would consider deep subprime,” the strategists wrote. “Auto loan fundamental performance, especially within ABS pools, continues to deteriorate.”
The percentage of subprime auto-loan securitizations considered deep subprime has risen to 32.5 percent from 5.1 percent since 2010, Morgan Stanley said. The researchers define deep subprime as lenders with consumer credit grades known as FICO scores below 550. The scale from Fair Isaac Corp. ranges from 300 to 850 and while there’s no firm definition of subprime, borrower scores below 600 are in general considered high credit risks.
The deteriorating performance has not been lost on the credit rating agencies. According to Bloomberg,
This month, however, S&P acknowledged that losses are building across the board — in prime, subprime as well as deep subprime. It revised its loss expectations for a wave of bond issuers of auto debt to reflect a new view that many deals may end up seeing losses far greater than initially expected.
“Many companies are increasing their loan loss provisions, which has caused some formerly profitable companies to become unprofitable. Other newly formed companies are still striving to break even,” analysts at S&P including Amy Martin said in a March 20 report.
Driving it may be that the definition of what subprime means has changed in the market after the last subprime crisis, they said.
Payment behavior among subprime borrowers after the crisis and up until around 2015 is different because those lenders were considered risky credits in an extreme situation following the recession, according to S&P. As the economy improved, so did the credit scores of such consumers. By 2015, that left subprime lenders with the dredges — the people who never paid, and who will likely never pay.
“Many of the subprime customers from 2015 to the present have a sustained history of late payments or charge-offs,” S&P wrote. “Stated slightly different, today’s subprime customer appears to be a weaker cohort than that of several years ago.”
The deterioration in subprime credit quality is not just limited to auto loans. Capital One is one of the largest credit card companies in the country. It derives approximately 59% of its revenue from its credit card business. This is fine while the economy is growing and customers have a margin of safety to withstand economic setbacks. When this is not the case, however, the business can be very challenging as the following chart shows.

Credit cards have the highest loss severity of all major credit categories. This makes sense because credit card lenders have no collateral so there is not the same cost in day to day living as compared to having one’s home foreclosed or car repossessed.
One can see that Capital One has a meaningful percentage of its credit card portfolio (37%) with FICO scores of 660 or below. Subprime is considered 640 or below but 641 to 660 is nothing to write home about so I think it’s fair to consider that entire cohort subprime.

With three Fed hikes in 16 months, credit cardholders have seen their interest rates rise. For those people who always pay off their balance, this is not an issue. For those who do not, however, such as Capital One’s customers, they have seen their carrying costs rise. Interestingly a smaller percentage of households have been carrying credit card balances between 2009 and 2014. It’s still a meaningful 34% as of 2014.

Capital One recently released its earnings report and the market was caught off guard by the following:
- Provision for credit losses of $1.992B up 14% from Q4 and 30%
- Y/Y. Allowance for loan and lease losses of $6.984B up 29% Y/Y; as a percent of loans held for investment of 2.9% up 52 basis points.
- Net charge-offs of $1.51B up 28%; net charge-off rate of 2.5% up 42 bps. 30-day delinquency rate of 2.92 up 28 bps.
- ROA of 0.90% down 33 basis points Y/Y; ROTCE of 10.37% down 257 bps.
Here are two important charts showing how credit quality has deteriorated with provisions for future loan losses rising significantly as well as net charge-off of loans (throwing in the towel).

It would appear that consumer credit is going to tighten up which will put pressure on spending, especially if the Fed raises again in June. It will be interesting if the Fed will be able to hike two or three more times this year. My guess is no.
Over to You:
You’ve seen the data and understand where I think the auto market is heading based on consumer credit. I welcome your thoughts!
I thought the auto market had peaked and was leveling because limited demand. I find your argument about credit issues compelling.