
Hurricane Michael created unfathomable devastation to Florida Panhandle beach communities. What was particularly insidious was how fast it formed and deprived people of precious time to evacuate. This picture is one representation of the fury of Mother Nature and the wrath she brought down. It’s possible the coastline and these communities may never be the same.

Whatever your view about climate change and its causes, to quote The Buffalo Springfield:
“There’s something happening here
What it is ain’t exactly clear.”
The following charts show some disturbing trends in ocean warming and hurricane activity. If this were a stock you would be happy to own it. But as a property owner exposed to warming waters, particularly in the Atlantic, you may want to think about the risks associated with it and consider selling.

The following chart captures what I’ve been thinking but didn’t have data to support until now: hurricanes are becoming more fierce more quickly. 2017 was the worst year on record for this. It will be interesting to see how 2018 stacks up after the hurricane season ends.

Which now brings me to the financial markets which experienced hurricane like activity last week. Here is the chart of the NASDAQ for the past three months. You can see the huge drop that recently took place.
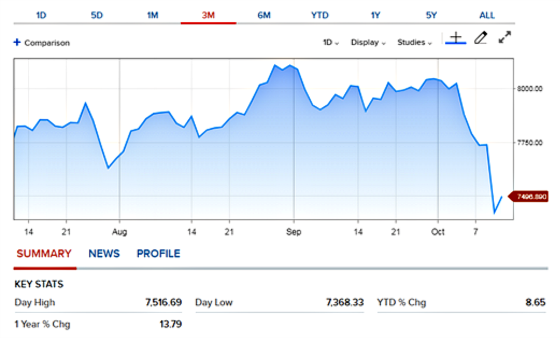
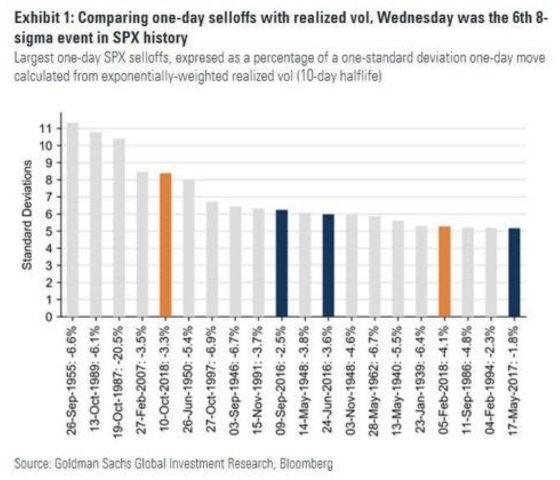
Like hurricanes that seem to be increasing in frequency and severity, it feels similar as well for the stock market. Wednesday’s brutal selloff shows how statistically anomalous this was, being an 8 sigma event, the 5th largest statistical anomaly in history according to Goldman Sachs.
From the same article I find this to be quite fascinating:
As Fishman adds, what makes the drop unique is that most of the top events of this severity, and listed in the chart above, “have often had a clear, dramatic, catalyst (1987 crash, Eisenhower heart attack, Korean war, large M&A event breakup).”
Part of the reason this week’s volatility looks like a tail event is that realized volatility had been surprisingly low prior to Wednesday: the five least-volatile quarters for the SPX over the past 20 years were Q1/2/3/4 of 2017, and Q3 of 2018.
For Goldman, the Wednesday spike is reminiscent of the Feb. 27, 2007’s China-led selloff, “which marked the end of an extended low-vol period.”
That said, Fishman also notes that mathematical tail events have been more common recently, almost as if central bank tinkering with markets has broken them, To wit, “five of the top 20 one-day highest-standard deviation moves (comparing the SPX selloff with ex-ante realized vol) since 1929 have happened in 2016-8.”
And now to end the post with my favorite subject and constant lament: the extreme positioning of speculative investors continuing to bet on higher rates. This chart shows that 10-year Treasury notes are the most extremely shorted investment in the market now.

This next chart shows how the positioning has gotten even more extreme as rates have risen.

I was talking to one of our partners last week about locking the rate on a loan for an acquisition. It was their choice to do a fixed rate loan and since they have the vast majority of the capital being invested we deferred to them about when to lock. We were in the unenviable position of being exposed to the run-up in rates that took place in such a short period of time, our own financial-like hurricane Michael. He asked my opinion about when I would lock and I said, not with 100% conviction by the way, that I would be inclined to ride it if the 10-year did not close above 3.25% because I thought that was a key support/resistance level. Sure enough, it held as the following chart shows and sure enough, they locked the next day. Career risk is a powerful force in the decision-making process and should never be underestimated.
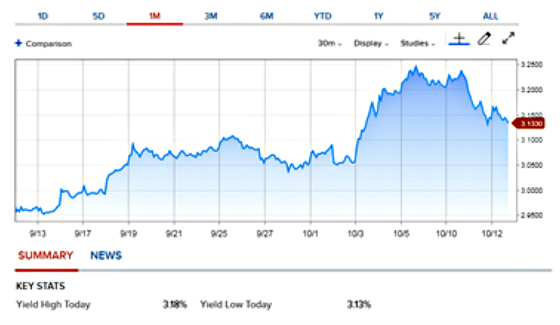
It looks to me like we could be heading back to somewhere in the 3.05% to 3.10% range. With that being said, however, I would have thought that we might have seen yields even lower after what happened in the stock market. On the other hand, it was a huge auction week as the Treasury sold more than $200 billion in Treasuries so there was a lot of supply to absorb.
This week will be very interesting to see what happens to stocks and bonds.
Leave a Reply