
Last week I wrote about how important the 2-Year Treasury note yield was to ascertain how close the Fed was to stopping its rate hikes and how high the Federal Funds Rate may reach. Based on past cycles and declaring that the 2-Year yield had peaked at 4.73% in November, I was in the camp that the Fed was going to be overtightening very soon and would not be able to keep its peak rate at 5%+ for very long.
On Thursday, when the ADP employment report came out, this prediction looked a little more at risk since investors deemed the report strong enough for the Fed to keep hiking. The 2-Year yield went up by 0.08% to close to 4.50%. Things changed on Friday, however, with the release of the non-farm payroll report. Although the headline jobs number was relatively strong, investors seemed to look below the surface and found a lot to like to support the narrative that the Fed may be able to engineer a soft landing.
Before getting to the labor market data, let’s first look at how investors were positioned regarding the 2-Year Treasury note. This chart from www.sentimentrader.com shows how professional hedgers are positioned. They are typically considered the “smart money” because they are often positioned to profit when rates have peaked or bottomed. One can see how they have never been more bullish on 2-Year Treasuries over the last 15 years.
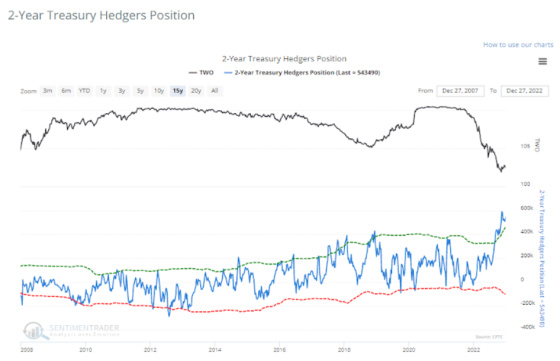
Professional hedgers have been buying more and more 2-Year Treasury futures as rates have been rising such that they are heavily positioned to prosper if the price rises and yields drop. Conversely, the “dumb money” is taking the opposite end of the trade and is positioned for rates to continue to increase. Thus, any mildly bullish news could trigger a large amount of buying from the more gun-shy, dumb money. And this is what happened on Friday after the jobs report was released. One can see how the 2-Year yield dropped sharply after the release of the report. The drop in rates wasn’t limited to the 2-Year as the table to the left shows. Long-term rates dropped materially as well.

So what was it that investors liked so much about the jobs report?
It wasn’t just bond investors but the stock market shot up as well, after falling sharply the previous day after the release of the ADP report. Probably the most important data point was the slowdown in wage growth. In a recent post on Medium, Minneapolis Fed President Neel Kashkari wrote the following.
Unfortunately, the initial surge in inflation is leading to broader inflationary pressures that the Federal Reserve must control. For example, nominal wage growth has grown to 5 percent or more, which is inconsistent with our 2 percent inflation target given recent trend productivity growth. Monetary policy is the appropriate tool to bring the labor market back into balance.
While he is fairly outspoken and unconventional, in this case, I think Kashkari’s focus on wage growth is very much in line with Jay Powell’s. Although still elevated, wage growth is very much in a downtrend as this chart shows.

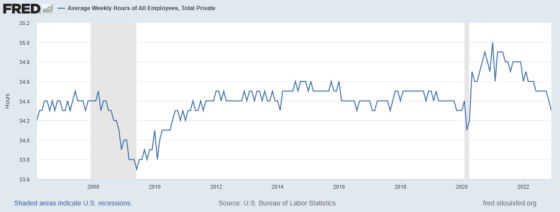
We are also seeing the average weekly hours of private sector employees dropping back to more normal levels after being quite elevated during Covid. This is typically a sign of less demand for labor and/or overtime. If this trend continues, then wage growth should continue to cool.
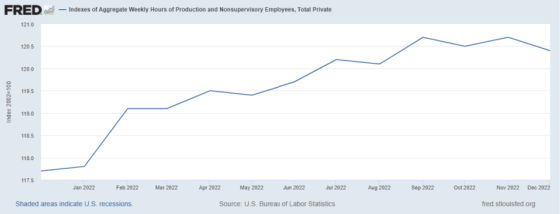
Overall, the number of hours being worked on a cumulative basis is dropping as well, which is another sign of cooling labor demand. This chart is an index of aggregate hours worked in the private sector, which shows the trend change to moving lower.
The demand for labor is bifurcated, with small businesses still finding it challenging to hire workers while large ones are shedding theirs. In addition, job openings continue to increase for smaller firms and drop for larger ones, although this trend has been in place for a while.

This chart starkly shows how large companies (500+ employees) have been cutting jobs. It’s not too far off from the levels seen during Covid.

This table goes into even more detail, showing the number of jobs created by firm size. On an aggregate basis, the only firms shedding jobs are those with 500+ employees.

Smaller firms are typically in the service sector, and this has been where the labor shortage has been most acute and wage growth quite strong. This chart suggests that momentum is weakening in the service sector, which may result in slower hiring in the year ahead.

This chart shows output by different industries. Financial firms are very much in the contraction mode, which isn’t too surprising given how rate hikes have really hammered residential real estate and slowed down mergers and acquisitions activity. Even if financial firms were excluded, most firms are still reducing output, which is another indicator that wage growth going forward may be more muted.

Here is the broad ISM Services Index, which clearly shows material weakness in new orders.

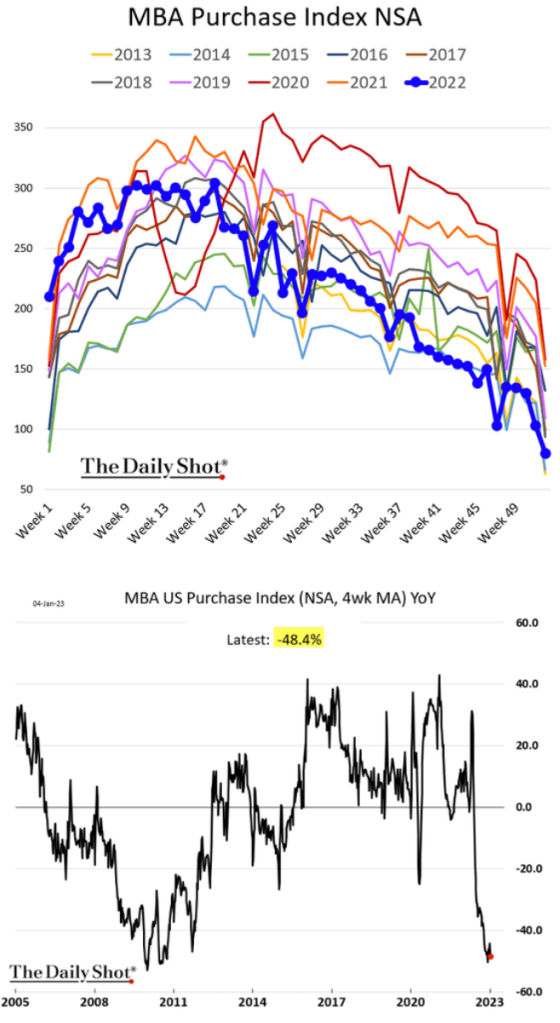
One can see how hard-hit residential real estate purchases have been by higher rates. Job prospects in this industry are not very rosy with such reduced transaction volume.
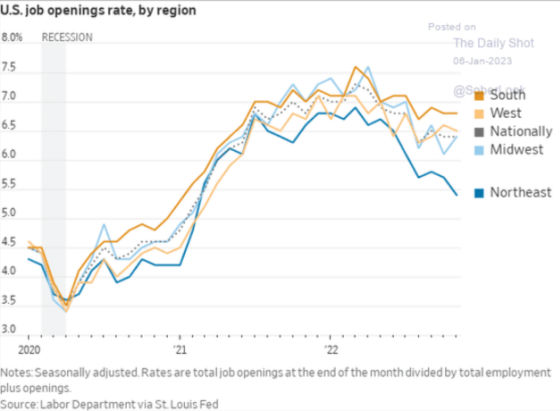
Finally, while job openings remain very high, the northeast’s number is dropping pretty significantly. Given how reliant New York and Boston are on financial firms, this is not too surprising.
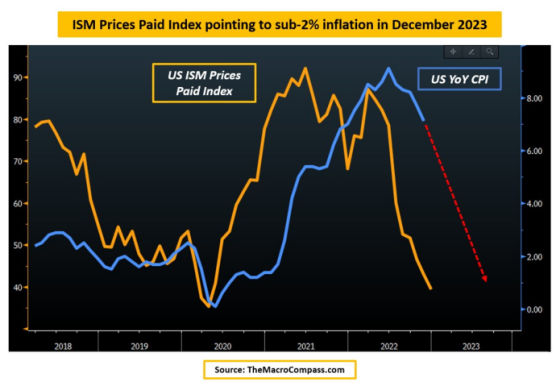
The bond market’s reaction to the jobs report revealed a very strong belief that the Fed is very near the end of its tightening cycle as the last holdout in inflation, wage growth, is now starting to decelerate in a very convincing manner. I’m still keeping my eye on the 2-Year yield to see if it drops back below 4%. If it does then the market will be shouting vociferously to the Fed that a Federal Funds Rate in excess of 4.50% for too long will eventually strangle the economy, especially when inflation looks to be clearly on a trend back to 2% as this chart shows.
Leave a Reply