
Mohamed El-Erian, the former CEO of PIMCO, said recently on CNBC that if you want to know what’s going to happen to U.S. long-term interest rates, then all you have to do is look to Germany. And so that is what I did.
The following chart shows the spread between 10-year yields in the United States and Germany since 1989. A few observations. One can see that the spread has now exceeded its previous 1989 peak. It also appears that when the spread reaches a cyclical peak that this has been a precursor to economic downturns approximately 20 to 24 months later. It seems that this spread is an indication of global economic health. When it is high, the economy is peaking and when it is low it is troughing. This makes sense in that the United States is typically the engine of growth for the world and its spending and willingness to run a trade deficit fuels growth in other countries. Now that China has entered the equation in a much more meaningful way, it’s not so cut and dried. Low German yields also reflect weaker economic activity in China.

One can see how weak German manufacturing has been as represented by the Purchasing Managers Index and puts its very low-interest rates in context as it is highly dependent upon exports for its growth.

After seeing a correlation between the U.S.- German spread and future recessions, I was then curious to see how the spread correlated with the differential between the 10-year Treasury note yield and 2-year as this is also considered a leading indicator of recession probability. If the U.S.-German spread being high is a leading indicator then one would expect the 10 year – 2-year differential to be quite low or negative as this is considered a precursor to a recession. The following chart tends to corroborate this as there is a negative correlation between the two yield spreads.
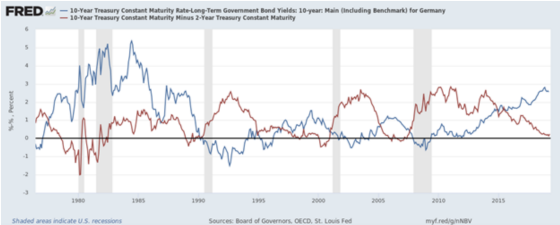
One can see that when the German minus U.S. spread is high then the U.S. 10 minus 2 spread is quite low, which is the case now. It would appear that we are closer to an economic peak than we are a trough based on these two indicators.
I then wanted to see how U.S. and German rates moved over the last 30 years. The next chart shows the 10-year yield for U.S. Treasury notes and German bunds. One can see that they have generally followed each other down through 2013 and then we have the first material divergence. The United States has not followed Germany down as German yields have collapsed to the zero bound and have gone negative. This is quite unusual in that the spread increase is almost entirely attributable to German rates moving lower.

In past cycles, the spread would increase by the U.S. going up more than Germany or going down less. As previously mentioned, this latest spread widening is unusual in that German yields have dropped by about 2% while U.S. yields have been relatively flat. El-Erian has intimated that U.S. yields cannot go materially higher without German yields rising as well and if they don’t, then U.S. yields will stay flat or drop. And from the first graph, it would appear that they could drop quite significantly if we enter into a recession as the spread has tended to go to zero or even negative.
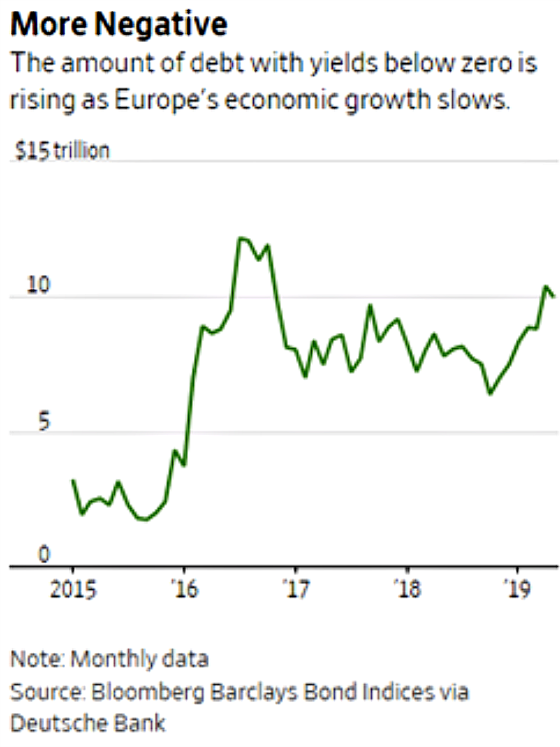
Another factor holding back U.S. yields is the huge amount of sovereign debt with negative yields. The following chart is from the Wall Street Journal discussing this phenomenon.
The article states the following:
The amount of negative-yielding government bonds outstanding through 2049 has risen 20% this year to about $10 trillion, the highest level since 2016, according to data from Deutsche Bank Securities.
The expanding pool of such bonds—which guarantee that a buyer will receive less in repayment and periodic interest than the buyer paid—highlights how expectations for growth in much of the developed world have deteriorated.
When all is said and done, pay attention to German yields.
Leave a Reply