You know Covid destroyed supply
Stimulus exploded demand
Inflation ran
The Fed cried
(What does the 10-year do?)
Break on through
To the other side
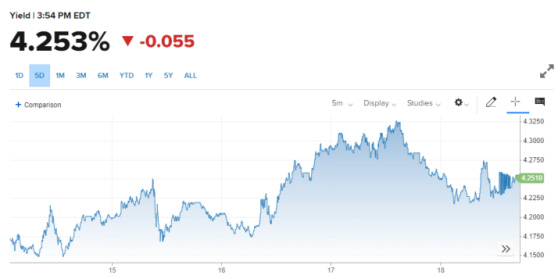
The 10-year Treasury yield broke through to a new cycle high and is now back above where it last peaked in 2008.

It hit a closing high of approximately 4.33% before dropping back down to 4.25% last Friday.
The Long Emergency
Now that the 2008 high has been breached, perhaps, upon further reflection, we can now classify the period between 2008 and 2022 as the Long Emergency, and that era has now come to an end in the wake of Covid and massive fiscal and monetary stimulus that created the escape velocity out of that disinflationary period in which the fear of deflation was much more of the concern than inflation.
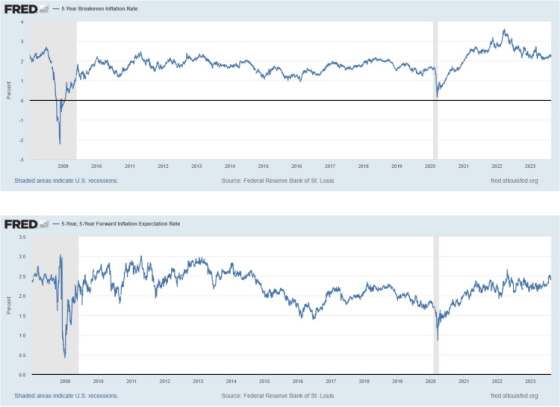
Despite the significant increase in inflation we have experienced, future inflation priced in by investors is still not meaningfully higher than it has been over a long period of time and is now back to levels it had been prior to Covid. 2% is the long-term steady-state projection for inflation.
So what has changed to push 10-year yields back above 4.25% after 15 years of being below that level? If we want to get real, then it’s due to investors requiring a higher inflation-adjusted rate of return that was negative to a maximum of 1% during the Long Emergency and now is back to around 2%, where it was prior to the Great Financial Crisis.

2% inflation plus 2% real equates to an equilibrium 10-year rate of approximately 4%. If you think that 2% inflation is more of a floor versus ceiling or average, then maybe it will be in the 4.25% to 4.50% range. I have written before that the average spread between the 10-year and 3-month T-Bill yield during cycles in which the yield curve has been positive has been 1.85% since 1990. If this relationship holds and the 10-year averages between 4.00% and 4.50%, then this would suggest future short-term rates could go back down to approximately 2.25% to 2.75%. Only time will tell if this happens.
So what has changed? I think part of it may have to do with the fact that most people understood that with enough fiscal and monetary stimulus, demand deficiency and low inflation could be tackled, but what had been lacking was the political will to make it happen. There was criticism of the Obama administration that the stimulus package applied during the GFC was not sufficient enough to help solve the problem in spite of the very large size of it on an absolute basis. The critics may have been right, as we had many years of sub-par growth and low rates, as evidenced by the negative real rates in the chart above. Everything changed with Covid when unprecedented fiscal and monetary stimulus was unleashed during a time when supply was constrained, thereby setting the stage for a big run-up in prices. People now know that this problem can now be tackled, so I know I will always keep this in the back of my mind when making investments and financing decisions.
Now add to this in our post-Covid world decoupling from China, a shrinking Chinese labor force, reshoring of manufacturing, protectionism, huge spending on green energy and infrastructure, the risk of higher energy prices to create more redundant energy supplies, aging societies with slow-growing or shrinking labor forces (beyond China) and, correspondingly, more labor power (e.g. UPS contract), and we are now facing more structurally rooted factors that will lead to more of an inflationary bias suggesting that 2% is more of a floor than ceiling when making capital deployment decisions.
In addition, throw in Japan’s rates now even going higher and China being a seller of Treasuries to shore up its currency, as well as for national security reasons, along with the Fed contracting its balance sheet in the face of continued large deficits, and we have some powerful reasons while real rates will stay in the 2% range.


Of course, we could end up with some sort of crisis that results in real rates dropping back down to close to 0% again, but that would not be my base case, and I would not bet on it. And yes, there are mounting costs and pressures building due to rates having risen so far so fast such that it’s very possible cracks will appear that will require the Fed to cut rates, but once again, I am not banking on them going back to 0%. My base case is 2.25% to 3.00%.
Very thoughtful analysis of significant changes in policy long term.